What is V Speed?
V (Volatility) Speed is a nifty indicator that shows the current high-low range of each bar on your trading chart. It also provides a smoothed average of the past three bars in the data window below. The default setting is three bars; however, if you're looking for a quick volatility signal, it’s best to use a shorter period. In other words, the lower the number, the more responsive it is to short-term volatility changes.
Why Use V Speed?
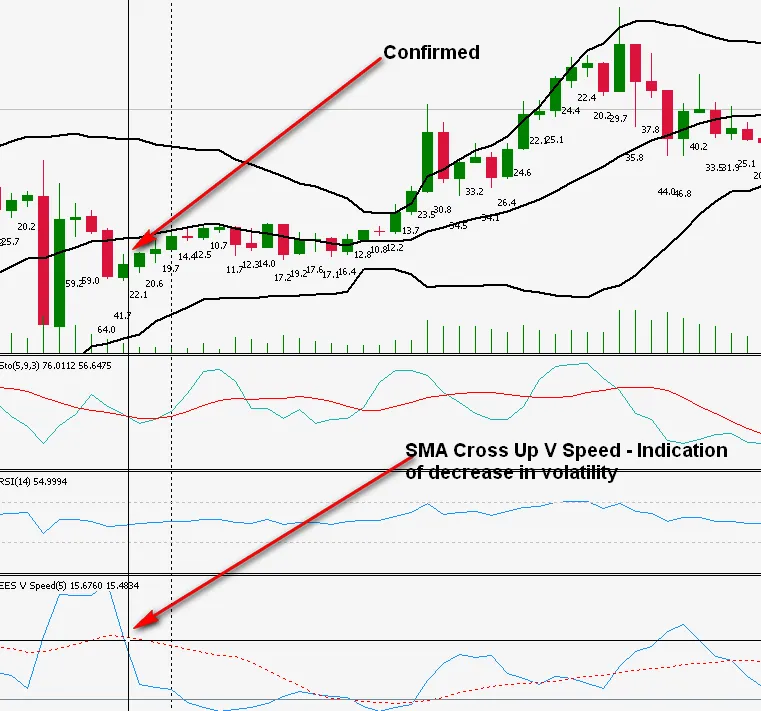
At EES, we recommend utilizing this indicator to measure volatility effectively. By keeping an eye on the Simple Moving Average (SMA), you can easily spot changes in volatility. For instance, when the SMA crosses above the V Speed line, it indicates a decrease in volatility; conversely, a cross below signals an increase. Remember, you can tweak the SMA values based on the currency pair and timeframe you’re trading.
The Speed Factor
The term 'speed' relates to how quickly volatility is shifting for your specific pair. It's worth noting that monitoring the VIX may not always be applicable for your trading strategy. V Speed also serves as a handy tool for displaying the high-low range of each bar, making it easier to gauge market movements.
Related Posts
- Unlocking the Power of Master Tools for MetaTrader 4
- Unlocking MetaCOT 2: Your Ultimate CFTC Indicator Toolkit for MT4
- Visualize Current Trends Across All Time Frames with This MetaTrader 4 Indicator
- Hourly Buffers for Data Collection in MetaTrader 5: A Simple Guide
- Mastering Support and Resistance: Essential Indicator for MetaTrader 4