The world of trading is full of complexities, and one concept that's gaining traction among traders is the Variation Index. This tool helps us understand market dynamics, and today, we'll break it down in a way that's easy to grasp.
The Fractal Nature of Financial Markets
Have you ever noticed how financial time series often showcase a fractal structure? This idea, popularized by mathematician Benoit Mandelbrot, suggests that stock and currency movements are independent of the time scale. Essentially, when you look at a chart, you can't tell whether it's reflecting weekly, daily, or hourly changes.
Calculating the Hurst Exponent
Typically, traders calculate the Hurst exponent to determine fractal dimensions. However, there’s a catch: you need a hefty amount of data—around 1,000 data points—to get reliable results. That’s a lot, especially when you consider how quickly trends can change in the trading world.
Introducing the Variation Index
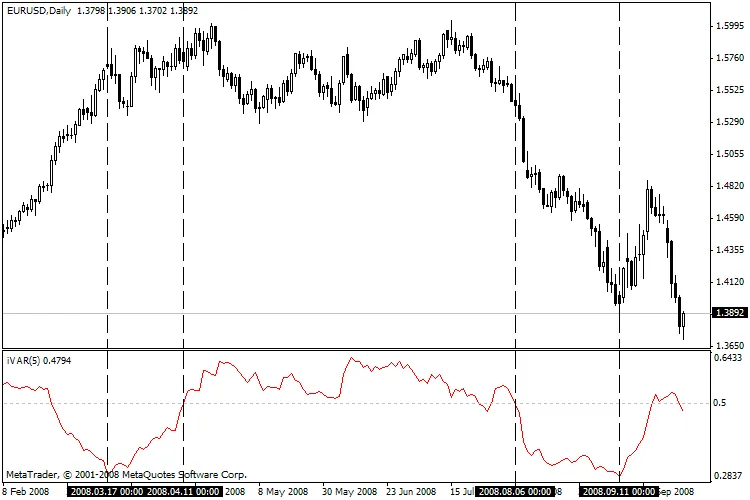
This is where the Variation Index (m) comes into play. Unlike the Hurst exponent, which requires extensive data, the Variation Index can be calculated with far less information. In fact, you only need half the data, making it a more practical tool for understanding price dynamics.
Here's the key takeaway: If m is less than 0.5, it indicates a trending market. Conversely, if m is greater than 0.5, the market is likely in a flat or range-bound state.
How to Use the Variation Index
So, how do we apply this indicator in our trading strategies? Here are some essential rules:
- If the Variation Index is below 0.5, it signals a trend in the market.
- A very low value often precedes a correction or end of the current trend.
- If the index is above 0.5, it indicates a flat market.
- An extremely high value can suggest the onset of significant trends.
- If the value hovers around 0.5, it indicates an uncertain market state.
In Conclusion
The Variation Index is an invaluable tool for any trader looking to navigate the complexities of the market. By understanding its signals, you can better position yourself for success. Happy trading!
Further Reading
For those who want to dive deeper, check out the following:
- M.M. Dubovikov et al., Dimension of the Minimal Cover and Local Analysis of Fractal Time Series, 2004.
- Edgar E. Peters, Fractal Market Analysis: Applying Chaos Theory to Investment and Economics, John Wiley & Sons, 2003.
Related Posts
- Unlocking the Power of Master Tools for MetaTrader 4
- Unlocking MetaCOT 2: Your Ultimate CFTC Indicator Toolkit for MT4
- Visualize Current Trends Across All Time Frames with This MetaTrader 4 Indicator
- Mastering the Waddah Attar Trend Alert Indicator for MetaTrader 5
- Unlocking the Power of ColorJFatl_Digit_Alert: Your Go-To MT5 Indicator