Hey there, fellow traders! Today, we’re diving into the Smoothed ADX, a nifty indicator that many of us have been asking about. Developed by John Ehlers, this tool aims to provide a clearer picture of market trends without the noise that often comes with traditional indicators. So, let’s unpack it!
What is the Smoothed ADX?
The Smoothed Average Directional Index (ADX) is an enhancement of the standard ADX used to gauge the strength of a trend. Unlike its predecessor, the Smoothed ADX filters out the 'twitchiness' that can make trading decisions tricky. Here's the code to get you started:
Inputs: {declaring inputs}
Length( 14 ),
ADXTrend( 25 ), alpha1(0.25), alpha2(0.33);
DMIPlus( 0 ), DMIMinus( 0 ), DMI( 0 ), ADX( 0 ),
DIPlusLead(0), DIMinusLead(0), DIPlusFinal(0), DIMinusFinal(0),
ADXLead(0), ADXFinal(0);
DIPlusFinal = alpha2*DIPlusLead + (1 - alpha2) * DIPlusFinal[1];
DIMinusFinal = alpha2*DIMinusLead + (1 - alpha2) * DIMinusFinal[1];
ADXFinal = alpha2*ADXLead + (1 - alpha2) * ADXFinal[1];
Plot3( ADXFinal, "ADX" ) ;
Now, if we break down the smoothing process, it consists of two main stages. First, we need to smooth a numerical sequence with minimal lag. For that, we define a function V(P) using the formula:
- P0 is the current value of the sequence (either a price or an indicator);
- P1 is the preceding value of the sequence;
- V1 is the previous oscillation value;
- V0 is the current oscillation value.
So, the formula looks like this:
V0 = (8*P0 - 7*P1 + 3*V1) / 4.
Alternatively, we can express it as:
V0 = (Vol(P) + 3*V1) / 4,
where:
Vol(P) = 8*P0 - 7*P1 - Ehlers' burst (a term I coined).
In the second stage, we apply simple weighted smoothing:
W0 = (1*V0 + 2*W1) / (2 + 1).
- W0 is the current smoothed value of sequence P;
- V0 is the current oscillation value;
- W1 is the preceding smoothed value.
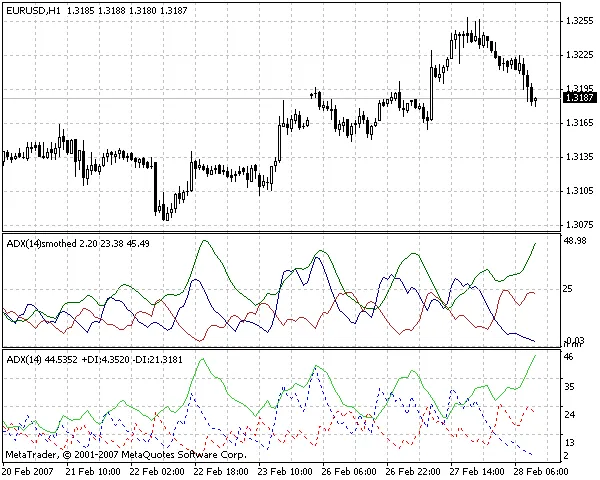
In the Smoothed ADX, we apply this smoothing technique to all three buffers of the standard ADX indicator. Hence, the name Smoothed ADX. If we were to smooth the RSI indicator, we’d call it Smoothed RSI, and so on.
Check out the image below, which clearly demonstrates how the Smoothed ADX is less 'twitchy' compared to the original ADX (Average Directional Movement Index):


Comments 0