Mastering the High, Low, and Close Indicator
Enhance Your Trading Strategy
Explore More Here
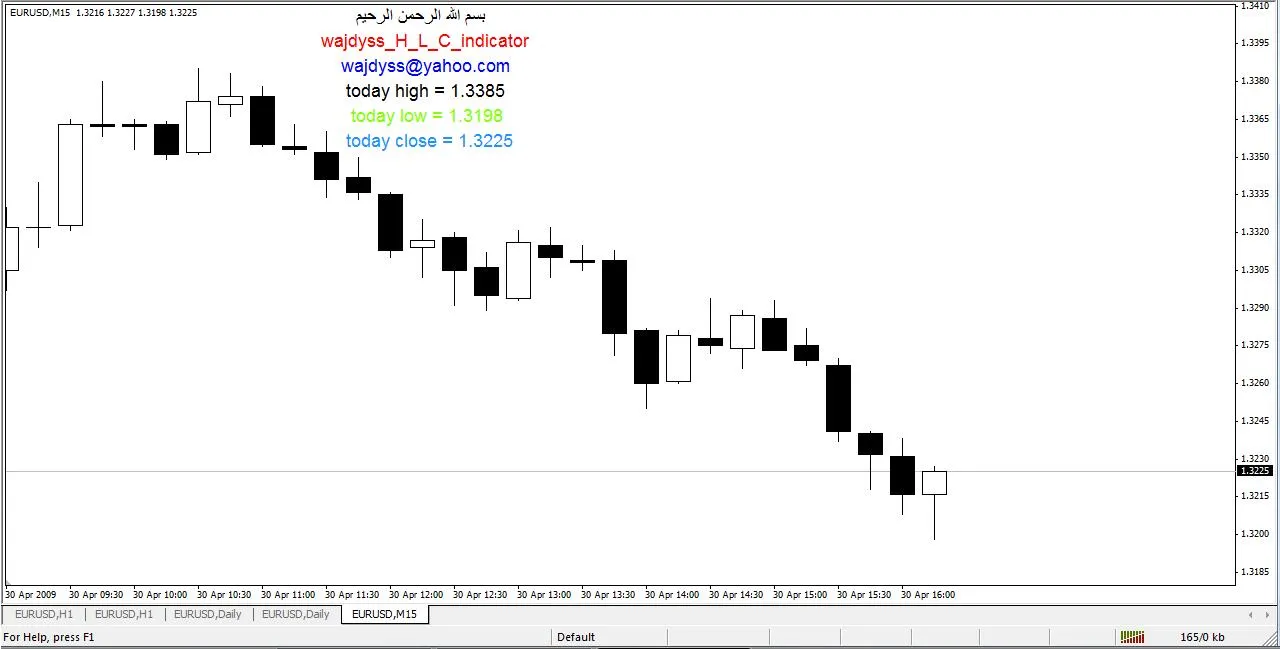
Hey there, fellow traders! Today we’re diving into an essential tool that can really sharpen your trading decisions: the High, Low, and Close (HLC) indicator. This nifty tool helps you get a clearer picture of market trends by showing the highest, lowest, and closing prices over a specific period.
Using the HLC indicator can be a game-changer for your trading strategy. Here’s why:
- Identify Trends: The HLC gives you a quick snapshot of how the market is moving. Are prices trending up or down? This indicator helps you spot those shifts.
- Support and Resistance Levels: By analyzing the high and low points, you can better understand potential support and resistance levels, which are crucial for making informed trading decisions.
- Improve Entry and Exit Points: Knowing where the close price lies in relation to the highs and lows can help you fine-tune your entry and exit strategies.
Want to learn more? Check out the full discussion on the forum!