Hey there, fellow traders! Today, we're diving into the Fractal Dimension Index (FDI), a nifty tool that can help us make sense of market movements.
What’s the Fractal Dimension Index?
As described by the legendary mathematician Benoit Mandelbrot, the Fractal Dimension Index is all about measuring how complicated and irregular something is. When it comes to trading, this index offers valuable insights into market behavior.
Think about market prices as either trending or ranging. During a strong bull run, prices tend to move sharply, sometimes looking almost like a straight line. However, if we believe that price movements should follow a more jagged, fractal-like pattern, we can predict that this near-straight movement is likely to end. This prediction can give us an edge for making profitable trades.
Trends and Ranges
After a significant trend, prices often take a breather and trade within a range for some time before the next big move. Imagine this as prices zigzagging back and forth, creating a rectangular pattern. A straight line or a flat plane isn't fractal, so we can reasonably expect prices to break out of this range and start behaving like a true fractal again.
How the FDI Works
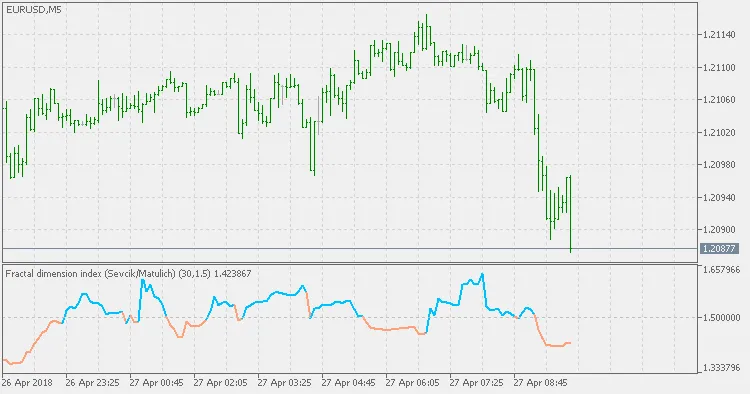
The beauty of the FDI is that it assigns a numerical value to the price movements on your chart, ranging from 1.0 to 2.0. If prices are moving in a nearly straight line, the FDI will be closer to 1.0. Conversely, if prices are more chaotic and resemble a two-dimensional plane, the FDI will edge closer to 2.0.
It's worth noting that this version of the FDI is based on the original work by Carlos Sevcik, but with a crucial correction made by Alex Matulich to address an error in the formula.
Related Posts
- Unlocking MetaCOT 2: Your Ultimate CFTC Indicator Toolkit for MT4
- Unlocking the Power of Master Tools for MetaTrader 4
- Visualize Current Trends Across All Time Frames with This MetaTrader 4 Indicator
- Maximize Your Trading Potential with the ColorX2MA_Alert Indicator for MetaTrader 5
- Unlocking the Power of ColorJFatl_Digit_Alert: Your Go-To MT5 Indicator