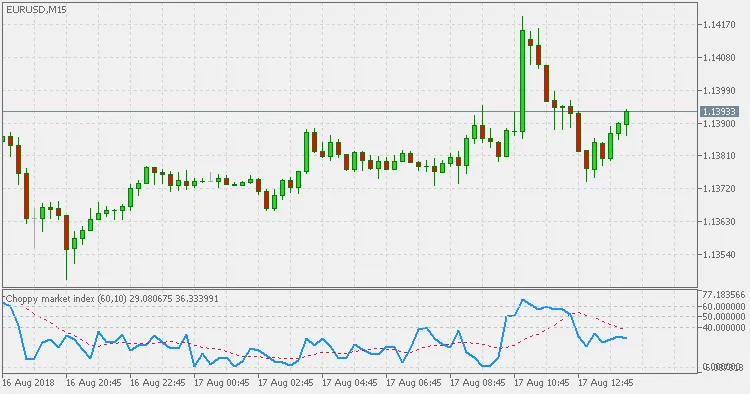
The Choppy Market Index (CMI) is a handy tool for traders looking to navigate both trending and ranging markets. First introduced by Daniel Fernandez in a 2011 article for Trading Strategies magazine, this indicator helps you determine whether the market is behaving in a choppy (non-directional) way or if it’s trending (directional).
Essentially, the CMI calculates the difference between the most recent closing price and the closing price from 'n' bars ago. This value is then divided by the range (the highest high minus the lowest low) over those same 'n' bars. To make it easier to read, the result is multiplied by 100, giving you a value between 0 and 100:
CMI = ((ABS(C[0]-C[n]))/(H[n]-L[n]))*100
Where:
ABS: Absolute value
C[0]: Most recent close
C[n]: Close 'n' bars ago
H[n]: Highest high of the past 'n' bars
L[n]: Lowest low of the past 'n' bars
Trading Strategies using CMI:
Range Strategy Rules:
- Enter a long position when the 10-bar SMA of the 60-bar CMI is below 40, and the difference between the current bar’s close and the close from 20 bars ago is negative.
- Enter a short position when the 10-bar SMA of the 60-bar CMI is below 40, and the difference between the current bar’s close and the close from 20 bars ago is positive.
- Exit trades when the CMI moves above 50.
Trend Strategy Rules:
- Enter a long position when the 10-bar SMA of the 60-bar CMI is above 60, and the difference between the current bar’s close and the close from 20 bars ago is positive.
- Enter a short position when the 10-bar SMA of the 60-bar CMI is above 60, and the difference between the current bar’s close and the close from 20 bars ago is negative.
- Exit trades when the CMI moves below 50.
Related Posts
- Unlocking MetaCOT 2: Your Ultimate CFTC Indicator Toolkit for MT4
- Hourly Buffers for Data Collection in MetaTrader 5: A Simple Guide
- Unlocking the Power of Master Tools for MetaTrader 4
- Mastering the MACD Candle Indicator for MetaTrader 4
- Visualize Current Trends Across All Time Frames with This MetaTrader 4 Indicator