Hey fellow traders! Today, I want to introduce you to an interesting indicator I've been exploring called BoDi, which is based on the well-known Bollinger Bands. If you’re looking to enhance your trading toolkit, this might just be what you need!
So, what are Bollinger Bands? In a nutshell, they consist of two lines positioned above and below a moving average, set a certain number of standard deviations away from it. When the market is volatile, these lines widen, and during calmer periods, they come closer together. This gives us a visual cue of potential price movement boundaries.
One fascinating observation about Bollinger Bands is that when the channel widens, it often indicates the formation of either a bullish or bearish price movement. Now, pinpointing the exact start of these moves can be tricky—usually, it’s easier to see in hindsight. However, we can use these patterns to identify when the momentum might be fading. Check out Figure 1, which shows how narrowing Bollinger Bands correlate with the tug-of-war between bulls and bears.
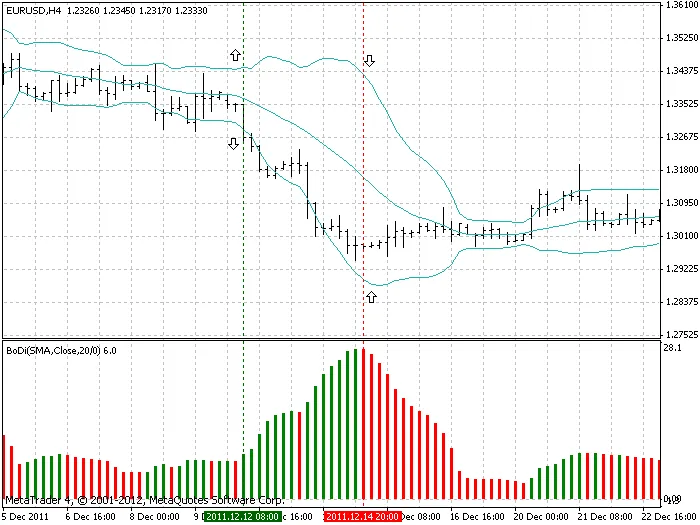
Figure 1. Bollinger Bands (on the chart) and BoDi (under the chart)
Now, let’s dive into how the BoDi indicator works. It calculates the difference between the upper and lower Bollinger Bands and presents this information as a histogram in a separate window. Since there wasn’t much literature on a similar algorithm, I’ve dubbed it BoDi, which stands for Bollinger's Difference.
How BoDi is Calculated
The calculation for the Bollinger Bands is as follows:
- D - number of standard deviations
- y - price for the i-th bar
- n - number of periods used for calculations
- UpperBB and LowerBB - upper and lower lines of Bollinger Bands
For BoDi, the formula is:
BoDi = (UpperBB - LowerBB) * 1000
- 1000 - a coefficient for better visualization.
This indicator works best on currencies that display impulsive behavior. As shown in Figure 1, when the price moves rapidly, the Bollinger Bands widen, and the BoDi histogram turns green. Conversely, when the price action slows down, the difference between the bands narrows, and BoDi’s histogram shifts to red. This can signal a good time to close a position, partially close it, or adjust your stop-loss to the breakeven point.
I highly recommend using BoDi as an additional tool for pinpointing exit points in trend-following and breakout trading strategies. Check out Figure 2 for some examples of how this works.
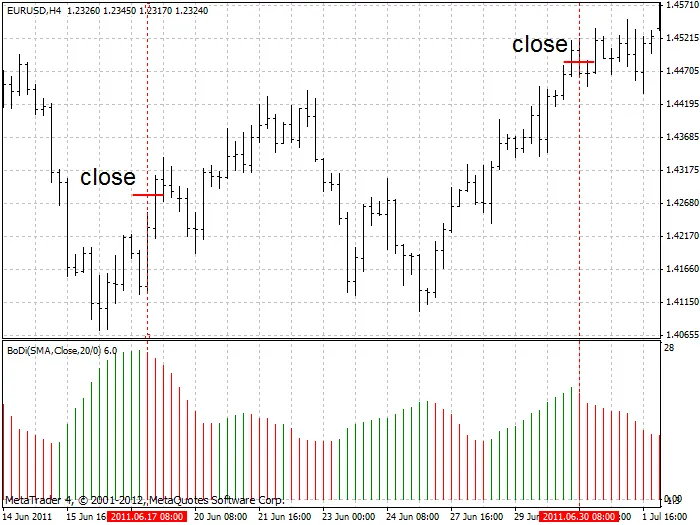
Figure 2. Examples of finding exit points.
For those of you using trading systems or expert advisors, here’s a simple algorithm to help find a good closing point:
1. BoDi [1] < BoDi [2],
2. BoDi [2] > BoDi [3], ... BoDi [n-1] > BoDi [n] (where n = 7 - 9),
3. BoDi [2] > BoDi [n] * k (where k = 1.5 - 2)
Where:
- [1] - index of the bar relative to the current (zero) bar
- n - number of the last bar used in calculation
- k - ratio of the second bar [2] to the last bar [n]
For the best results, I recommend calculating BoDi based on the exponential moving average (EMA) with a period of 20 and using the typical price as your base. Happy trading!
Related Posts
- Unlocking MetaCOT 2: Your Ultimate CFTC Indicator Toolkit for MT4
- Unlocking the Power of Master Tools for MetaTrader 4
- Unlock Trading Insights with Volume Profile + Range v6.0 for MetaTrader 5
- Visualize Current Trends Across All Time Frames with This MetaTrader 4 Indicator
- Mastering the MACD Candle Indicator for MetaTrader 4