Welcome, fellow traders! Today, we're diving into the Blau Ergodic True Strength Index (TSI), a powerful tool developed by the renowned trader William Blau.
What is the Ergodic TSI?
The True Strength Index (TSI) is essentially a smoothed momentum indicator. It's calculated using the following formula:
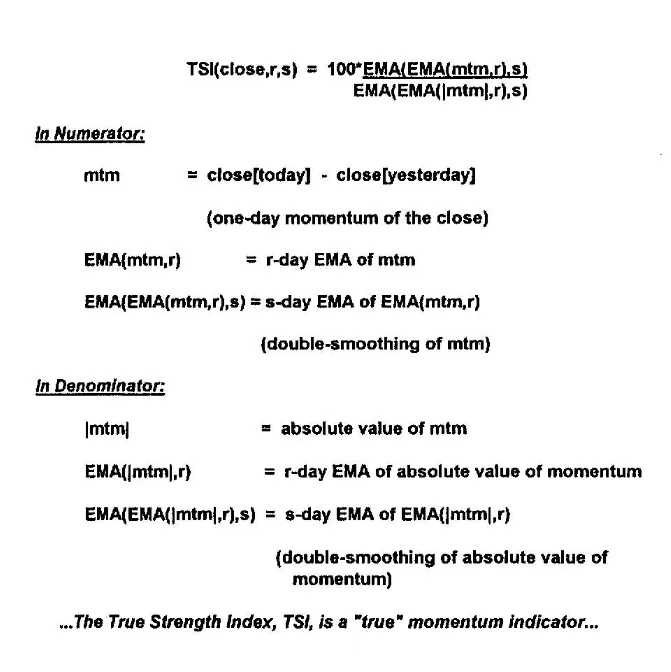
William Blau takes it a step further by defining the Ergodic TSI as:
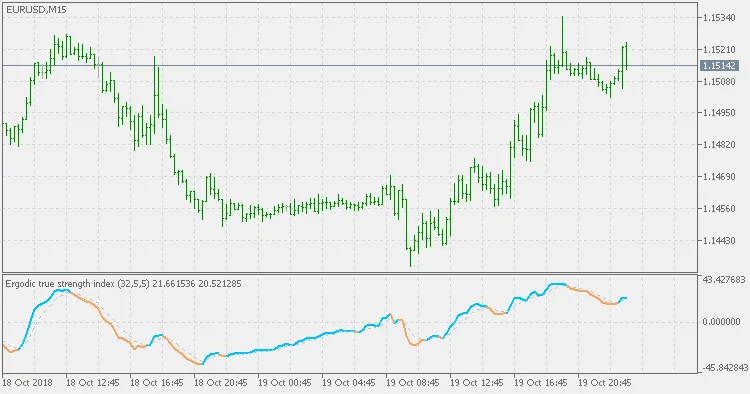
The Ergodic indicator is a double-smoothed TSI, where one of the smoothing periods is fixed at five price bars. An additional Exponential Moving Average (EMA) smoothing creates its signal line.In simpler terms, if either of the smoothing periods is set to 5, you’re looking at an Ergodic oscillator—or, in this case, the Ergodic TSI.
Key Features:
This indicator can distinguish between an "Ergodic" TSI and a regular TSI. Plus, it offers three color modes to enhance your decision-making:
- Color change on signal line cross
- Color change on zero line cross
- Color change on TSI line slope direction change
How to Use It:
The color changes can serve as valuable signals for your trades. While Blau’s definition is a strong starting point, don't hesitate to experiment with different smoothing parameters. Many traders find success using settings like 25 and 13 for the first two smoothing periods, which can yield favorable results across various market conditions.

Happy trading, and may the Blau Ergodic TSI guide you towards profitable decisions!
Related Posts
- Unlocking MetaCOT 2: Your Ultimate CFTC Indicator Toolkit for MT4
- Visualize Current Trends Across All Time Frames with This MetaTrader 4 Indicator
- Mastering the MACD Candle Indicator for MetaTrader 4
- Hourly Buffers for Data Collection in MetaTrader 5: A Simple Guide
- Unlocking the Power of Master Tools for MetaTrader 4