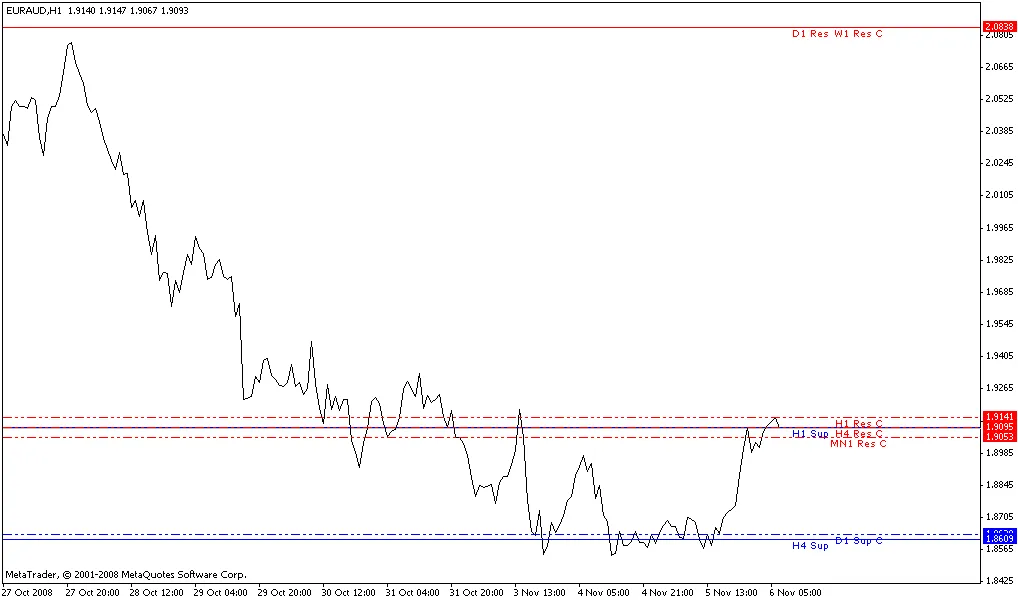
When it comes to trading, understanding support and resistance levels is crucial. In our ThreeLineBreak charts, blue lines represent support levels, while red lines indicate resistance levels.
Now, take a look at the dashed lines—these are potential candidates for breaks. They can offer valuable insights into market movements.
The number of lines that we consider when there’s a breakthrough is controlled by the LB parameter of the indicator. This is an essential feature that helps refine your trading strategy.
Related Posts
- Unlocking MetaCOT 2: Your Ultimate CFTC Indicator Toolkit for MT4
- Unlocking the Power of Master Tools for MetaTrader 4
- Mastering the Open Range Breakout Indicator for MetaTrader 5
- Visualize Current Trends Across All Time Frames with This MetaTrader 4 Indicator
- ID Lite Info MA: A Comprehensive Indicator for MetaTrader 5