If you're looking to enhance your trading strategy, the Standard Error Bands indicator in MetaTrader 5 could be a game-changer. This tool utilizes a smoothed linear regression line to help you identify potential price channels, allowing you to make informed trading decisions.
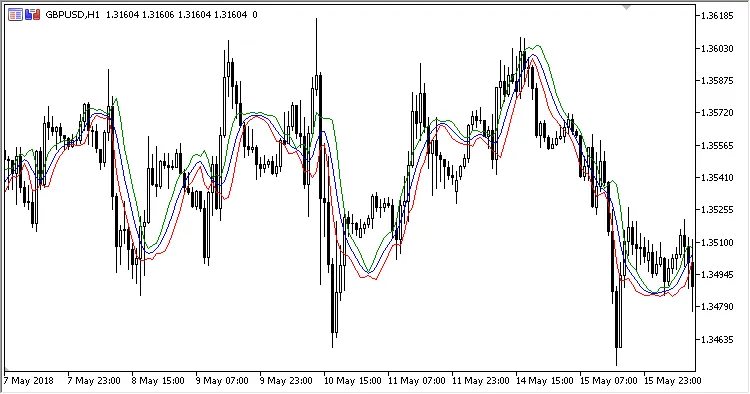
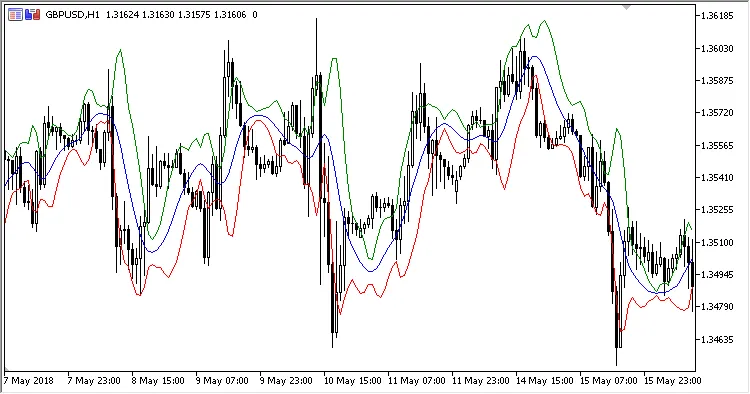
The Smoothed Linear Regression Line is calculated using a 21-period linear regression curve, which is then refined by a three-period simple moving average. The Upper Channel Line is formed by adding two standard errors to this regression line, while the Lower Channel Line is derived by subtracting two standard errors. This creates a visual representation of price volatility, giving you a clearer picture of market movements.
Originally introduced by John Andersen in the September 1996 issue of Stock and Commodities, this indicator remains a popular choice among traders for its straightforward approach.
Key Inputs for the Standard Error Bands Indicator
- Regression Period - This sets the length of the linear regression calculation.
- Smoothing Period - This defines how much smoothing will be applied to the regression line.
- Multiplier - This is the ratio for standard deviation, which determines the distance of the channel lines from the central line.
- Applied Price - Select which price data will be used in the calculation.
Calculation of the Indicator:
Central = SMA(LReg, Smoothing period)
Top = Central + Multiplier * Deviation
Bottom = Central - Multiplier * Deviation
Where:
Deviation = StdDev(LReg, Smoothing period)
LReg - linear regression at 'Applied price' with the 'Regression period' calculation period.
Related Posts
- Unlocking MetaCOT 2: Your Ultimate CFTC Indicator Toolkit for MT4
- Unlocking the Power of Master Tools for MetaTrader 4
- Visualize Current Trends Across All Time Frames with This MetaTrader 4 Indicator
- Mastering the MACD Candle Indicator for MetaTrader 4
- Unlock Trading Insights with Volume Profile + Range v6.0 for MetaTrader 5