When it comes to analyzing market trends, the Spearman rank correlation is a go-to tool for many traders. Typically, this method is paired with fixed levels that signal a strong correlation—whether positive or negative. However, today, we’re diving into a version that incorporates floating levels, which can provide a more flexible approach to measuring correlation strength.
Theory:
Developed by Spearman back in 1904, the Spearman rank correlation is a nonparametric statistic used to measure the strength of the relationship between two variables. It’s especially handy when the data distribution makes Pearson's correlation less reliable. You can think of it as a way to gauge monotonic relationships without the need for a normal distribution.
The Spearman rank correlation coefficient is formulated as follows:

Here, the expression represents the difference in statistical ranks of the corresponding variables, and it serves as an estimate of the true correlation coefficient.
Usage:
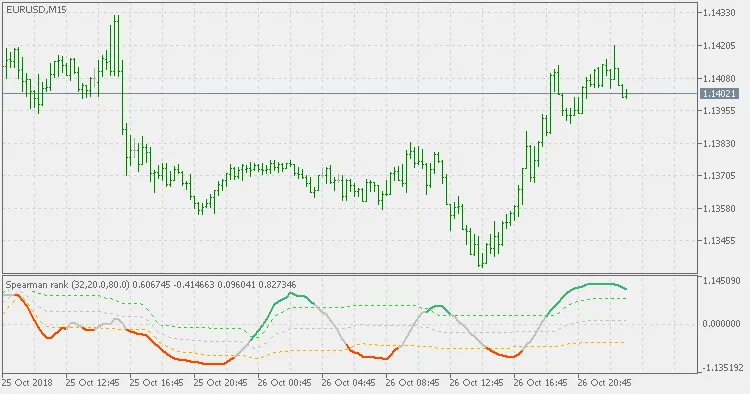
One of the practical uses of the Spearman rank correlation is to watch for color changes in your indicator as a potential trading signal. This can help you make informed decisions based on the strength of the correlation.
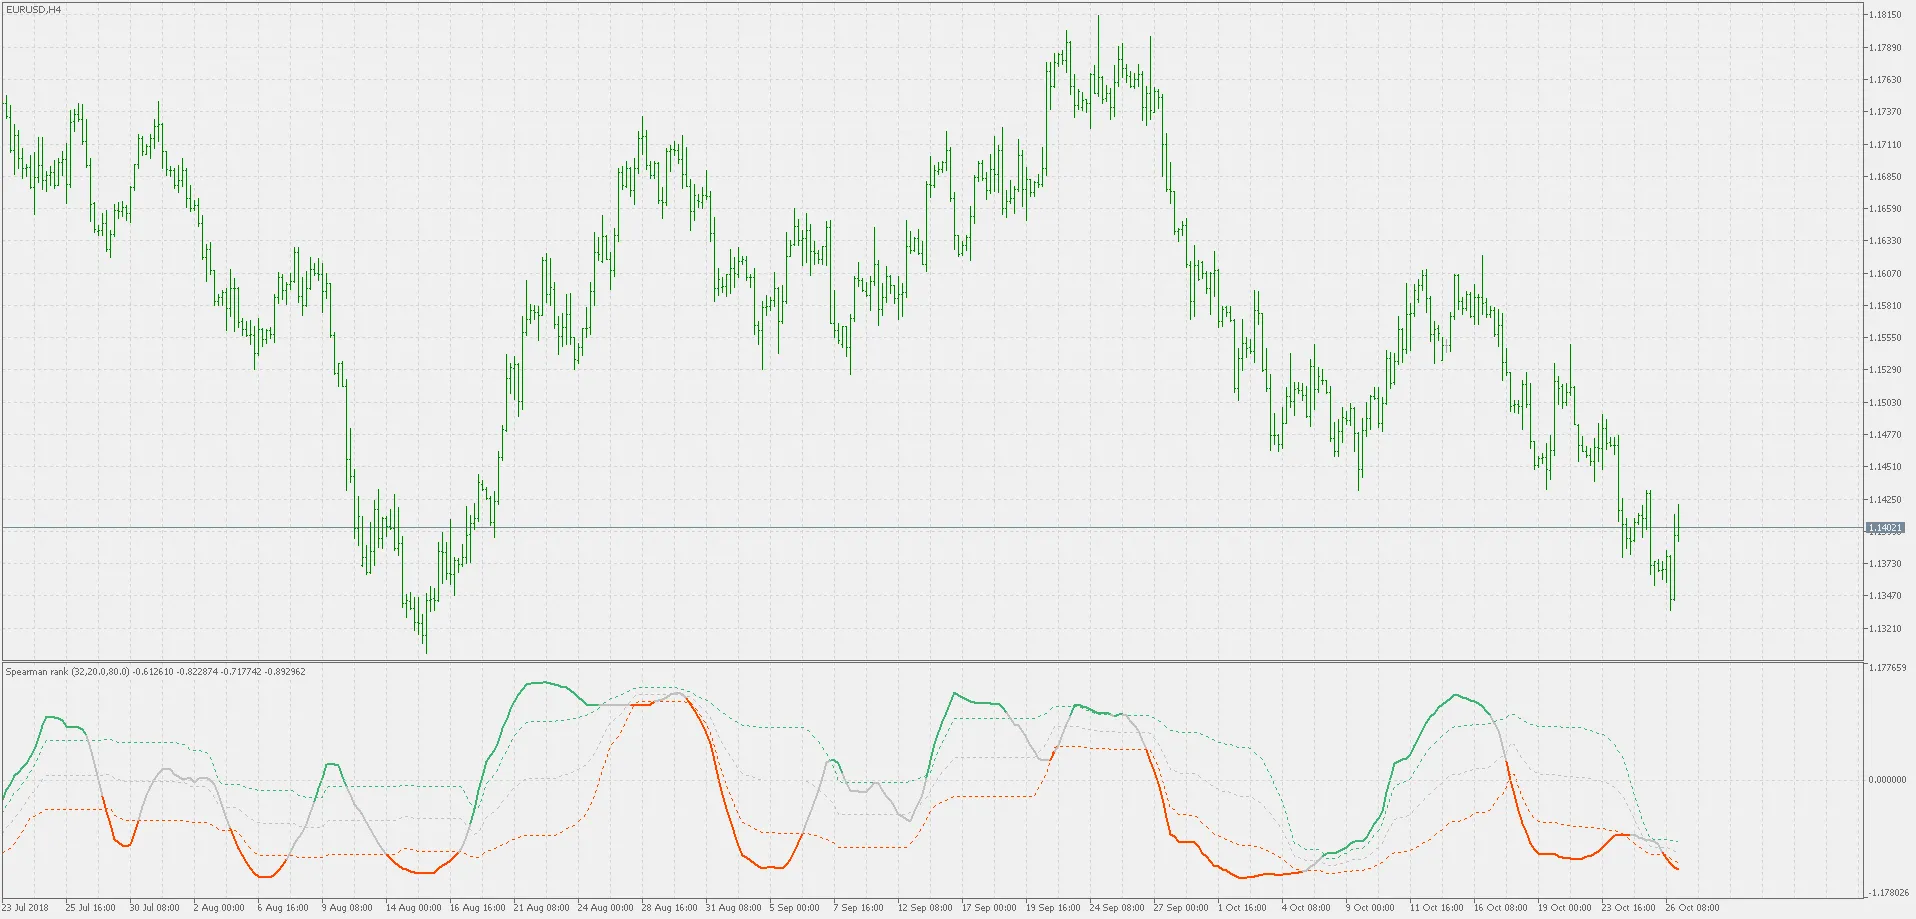
As a bonus, let’s take a look at a “big picture” example that showcases how floating levels can enhance your estimates when applying the Spearman rank correlation.
Related Posts
- Unlocking MetaCOT 2: Your Ultimate CFTC Indicator Toolkit for MT4
- Unlocking the Power of Master Tools for MetaTrader 4
- Visualize Current Trends Across All Time Frames with This MetaTrader 4 Indicator
- Mastering the FE Fibonacci Expansion Indicator for MetaTrader 4
- Unlocking the Power of ColorJFatl_Digit_Alert: Your Go-To MT5 Indicator