Author: Not specified
Hey fellow traders! Today, we’re diving into the Range Action Verification Index, or RAVI for short. This indicator is a game-changer, developed on principles that differ from the ADX. T. Chand, the brains behind this tool, suggests using a 13-week Simple Moving Average (SMA) as the backbone of RAVI. This approach gives you insight into the market’s behavior over a quarter (that’s about 65 trading days) concerning price actions.
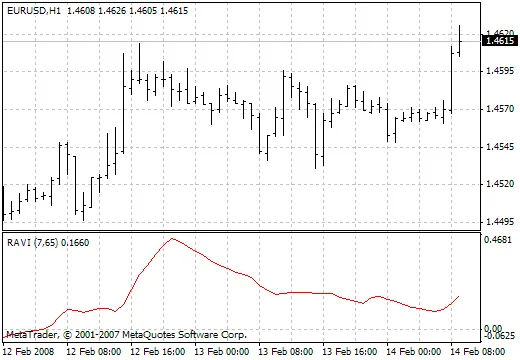
When it comes to the indicator’s parameters, Chand recommends two key lines: plus or minus 0.3% or 0.1%, depending on the market conditions. Here’s the scoop: if RAVI crosses the upper line from the bottom up, it signals the start of an uptrend. Conversely, if it dips below the lower line from above, a downtrend is likely kicking off. As long as the RAVI line continues to rise, it indicates that the uptrend is intact. The same goes for a downtrend, which persists as long as the RAVI line is falling. A return to the zero line suggests that the trend has ended and a channel phase has begun. If RAVI reverses again without crossing back between the info lines, it signals that the trend is back on.
Now, let’s break down the RAVI indicator itself. It’s quite straightforward and shares similarities with the Price Oscillator and MACD. What sets RAVI apart is its focus on the convergence-divergence rate as a trend indicator, emphasizing divergence rather than mere average intersections.
In terms of smoothing techniques, RAVI is a bit different compared to ADX. While ADX uses two smoothing methods, RAVI utilizes just one. This single smoothing makes the indicator more responsive, allowing it to alert you to the beginnings and endings of trends sooner than the 18-day ADX would.
Related Posts
- Unlocking MetaCOT 2: Your Ultimate CFTC Indicator Toolkit for MT4
- Visualize Current Trends Across All Time Frames with This MetaTrader 4 Indicator
- Unlocking the Power of Master Tools for MetaTrader 4
- Mastering the MACD Candle Indicator for MetaTrader 4
- Hourly Buffers for Data Collection in MetaTrader 5: A Simple Guide