Hey fellow traders! Today, we're diving into the fascinating world of price gaps using an indicator designed for MetaTrader 5. If you've ever noticed sudden price jumps on your charts, you're already familiar with gaps, and this tool is here to help you make sense of them.
The price gaps indicator showcases gaps as a histogram for easy visualization. Here's the scoop:
- Red bars indicate an upward gap, which statistically tends to fill downward.
- Blue bars represent a downward gap, and these are likely to fill upward.
But wait, there’s more! This indicator comes with a nifty feature that lets you filter gaps based on their size. By adjusting the inpBigGap parameter to a positive value, a BigGap line will pop up in a subwindow. Any gaps smaller than this line will be shaded in gray, making them easy to spot.
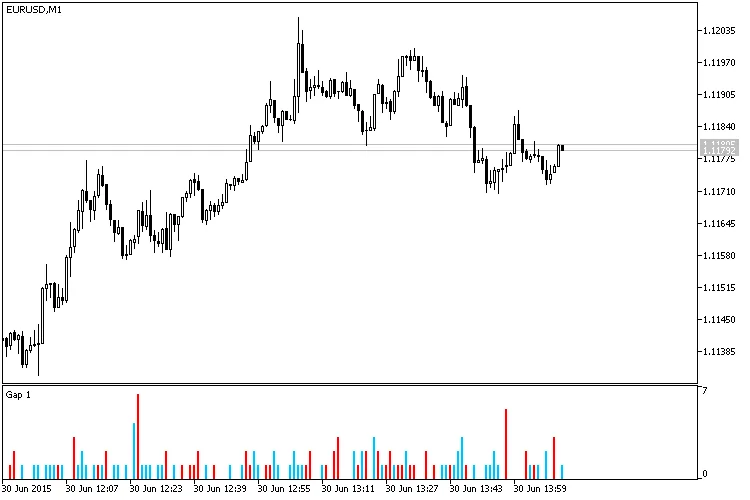
Fig.1. M1 timeframe with inpBigGap = 0
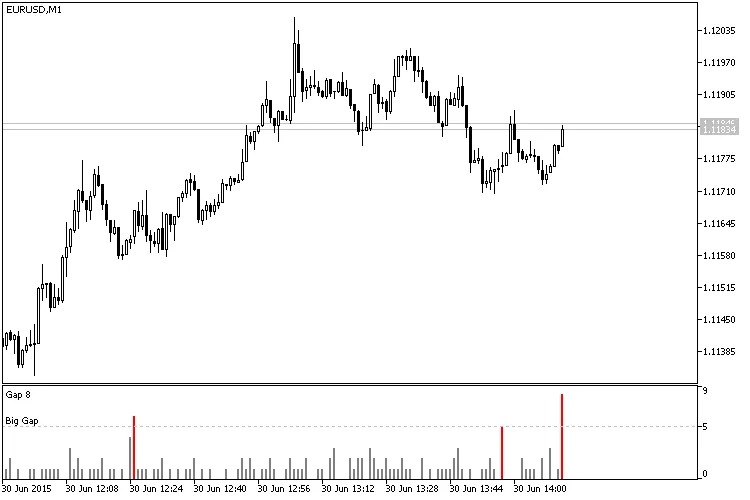
Fig.2. M1 timeframe with inpBigGap = 5

Fig.3. D1 timeframe with inpBigGap = 500
So, whether you’re trading on the M1 or D1 timeframe, understanding these gaps can give you a trading edge. Keep an eye on those bars, filter them to suit your style, and happy trading!
Related Posts
- Unlocking MetaCOT 2: Your Ultimate CFTC Indicator Toolkit for MT4
- Visualize Current Trends Across All Time Frames with This MetaTrader 4 Indicator
- Unlock Trading Insights with Volume Profile + Range v6.0 for MetaTrader 5
- Mastering the MACD Candle Indicator for MetaTrader 4
- Unlocking the Power of Master Tools for MetaTrader 4