Hey traders! Today, let's dive into an exciting variant of the classic ZigZag indicator — the MultiZigZag. This nifty tool has its roots in the algorithm introduced with MetaTrader 4 back in 2005-2006, and it's come a long way since then!
First off, I want to give a shoutout to Rosh for translating this algorithm into MQL4. If anyone knows who originally came up with this algorithm, drop their name or nickname in the comments. I'm all ears!
What’s New in MultiZigZag?
The MultiZigZag has addressed some significant shortcomings of its predecessor:
- CPU Load: The older version was a processor hog, recalculating the zigzag on every tick, which could choke low-power PCs during volatile market swings.
- Accuracy Issues: The old zigzag sometimes left lines dangling “in the air,” failing to accurately represent the bar’s highs and lows. We need precision, right?
- History Scrolling Problems: Scrolling back in time often made the zigzag hover around without a solid visual connection to the chart.
The MultiZigZag has eliminated these headaches. Now, only the last three segments of the zigzag are recalculated, and this happens only when the price moves beyond the calculated zero bar. In other words, recalculations kick in when a new bar appears or when the minimum or maximum of the zero bar is zeroed out.
Buffer Management
Each segment of the zigzag utilizes two buffers—one for highs and one for lows—allowing you to display both on a single bar. Plus, there are two additional buffers available for those looking to customize further. This could be a great opportunity for budding MQL4 programmers to get their hands dirty!
Advanced Features
The MultiZigZag calculates and draws lines from higher timeframes without the need for the icustom() function. This means we can simultaneously calculate zigzags across multiple timeframes and symbols, assuming you've got enough RAM to handle it. It also allows for pattern searching, like Gartley patterns, across various timeframes — very handy!
Parameter Breakdown
Key Parameters:
Most external parameters are string variables, and you can separate parameters with commas for each zigzag. Here’s a quick rundown:
- ExtDepth: Sets the depth for the zigzag. If you set it to 0, that zigzag won’t be displayed.
- ExtMaxBar: Defines how many bars will be used for zigzag calculations.
- GrossPeriod: Indicates the chart periods (in minutes) for data collection. Set it to 0 for the current timeframe.
You can choose values like 0, 1, 5, 15, 30, 60, 240, 1440, 10080, or 43200. And remember, ExtReCalculate determines how many highs/lows are recalculated in real-time. It’s best to leave this parameter as is.
By default, MultiZigZag displays data from H1, H4, and D1 timeframes, but it works beautifully from 1-minute to daily charts. Just a heads-up: only the zigzag based on D1 data will show up on daily charts.
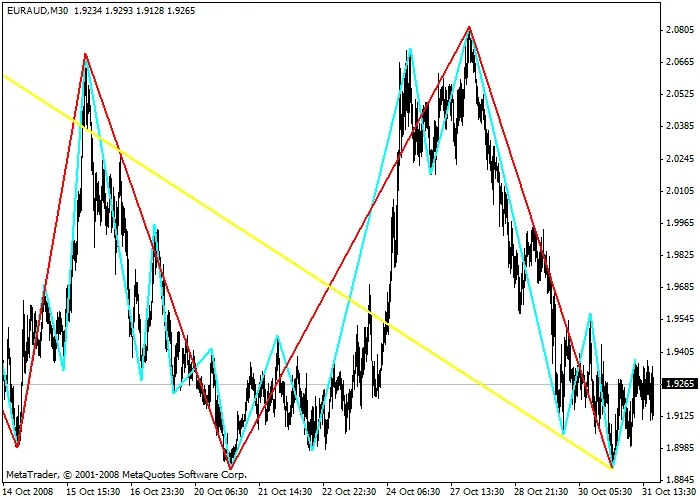
Check out the example below: the H1 zigzag is Aqua, H4 is Red, and D1 is Yellow!
So, there you have it! The MultiZigZag is a powerful tool that enhances your trading toolkit. Have you tried it out? Let me know your thoughts in the comments below!
Related Posts
- Unlocking the Professional ZigZag Indicator for MetaTrader 5
- Unlocking MetaCOT 2: Your Ultimate CFTC Indicator Toolkit for MT4
- Unlocking the Power of Master Tools for MetaTrader 4
- Unlock Trading Insights with Volume Profile + Range v6.0 for MetaTrader 5
- Unlocking the Power of the ZigZag Indicator for MetaTrader 4