Hey fellow traders! Today, we're diving into a fascinating indicator known as Generalized Quantile Bands. If you’re looking for a fresh perspective on your trading strategies, this might just be the ticket.
What Are Quantiles?
So, let’s start with the basics. In statistics, quantiles are cut points that divide a range of data into equal intervals. Imagine slicing a pie into equal pieces – that’s what quantiles do, but with data. For instance, quartiles break a dataset into four parts, while deciles create ten. The number of quantiles is always one less than the number of segments you create.
When we talk about q-quantiles, we’re referring to values that split a dataset into q nearly equal groups. For example, the median (or 2-quantile) is a common quantile that represents the middle value in a dataset.
Generalized Quantile Bands Explained
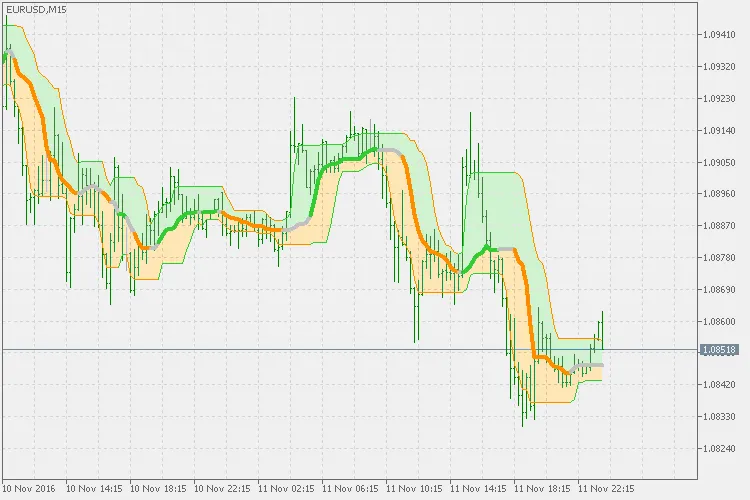
Now, onto the cool part. The Generalized Quantile Bands indicator is a bit different from the typical bands you might be used to. While most bands rely on three price points, this version uses just one price. You can also adjust the period to find the high and low values, making it quite versatile.
Even if you keep the high/low period set to 1, the bands will still provide solid calculations. Trust me, in most cases, you won’t even need to mess with those settings!
Why 'Generalized'?
You might be wondering about the term “generalized.” The beauty of this indicator is its flexibility. It isn’t limited to just price data; you can apply it to any indicator. For example, using quantile bands with RSI or stochastic can yield some pretty interesting results!
So, whether you’re a seasoned trader or just starting out, give the Generalized Quantile Bands a shot. You might find that it adds a unique twist to your trading strategy!
Related Posts
- Unlocking MetaCOT 2: Your Ultimate CFTC Indicator Toolkit for MT4
- Mastering the MACD Candle Indicator for MetaTrader 4
- Visualize Current Trends Across All Time Frames with This MetaTrader 4 Indicator
- Unlocking the Power of Master Tools for MetaTrader 4
- Hourly Buffers for Data Collection in MetaTrader 5: A Simple Guide