If you're diving into the world of trading, you’ve probably come across various indicators that can help you make better decisions. One such indicator is Fractional Bands, which takes a unique approach to price variation using Fractional Brownian Motion. Unlike the more familiar Bollinger Bands, which rely on Wiener Brownian Motion, Fractional Bands introduce the concept of fractal dimensions into the mix.
So, what does that mean for you as a trader? While the mathematical foundation of Fractional Bands may seem more robust, it doesn't always translate into a more useful trading tool. Many traders find them less effective compared to their Bollinger counterparts. However, they might still hold some value when used alongside other indicators in your trading strategy.
For a deeper dive into the mechanics of Fractional Bands and how they stack up against Fractal Bands, check out my blog: Fractal Finance.
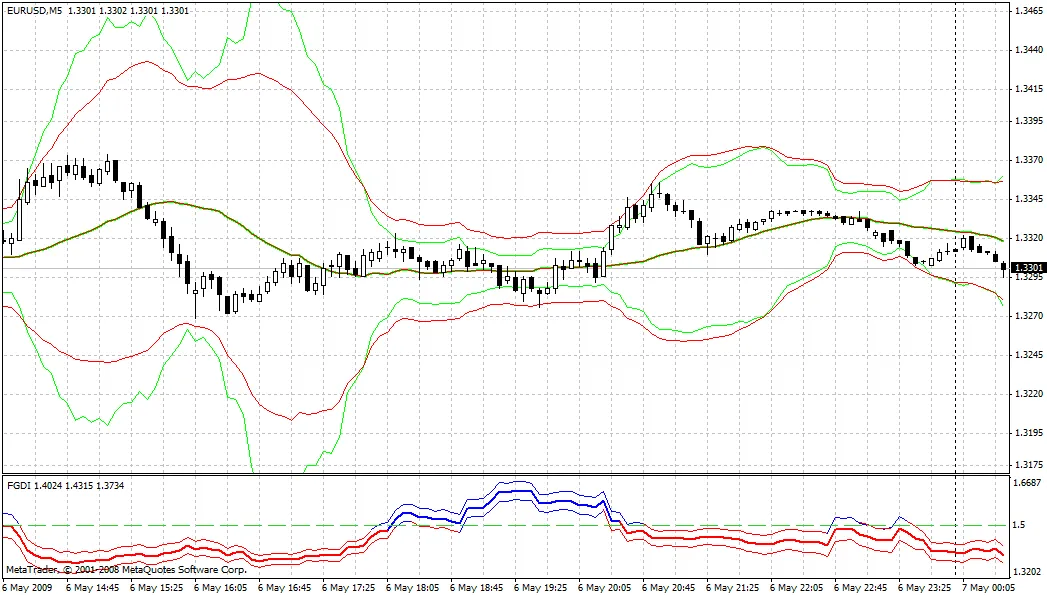
Take a look at this comparison: below you’ll see Fractional Bands (in lime green) alongside Fractal Bands (in red). Both indicators share the same moving average, known as FRASMA. This can help you visualize how they interact:
Related Posts
- Unlocking MetaCOT 2: Your Ultimate CFTC Indicator Toolkit for MT4
- Unlocking the Power of Multi-Timeframe Tymen STARC Bands for MetaTrader 5
- Unlocking the Power of Master Tools for MetaTrader 4
- Visualize Current Trends Across All Time Frames with This MetaTrader 4 Indicator
- Mastering the Open Range Breakout Indicator for MetaTrader 5