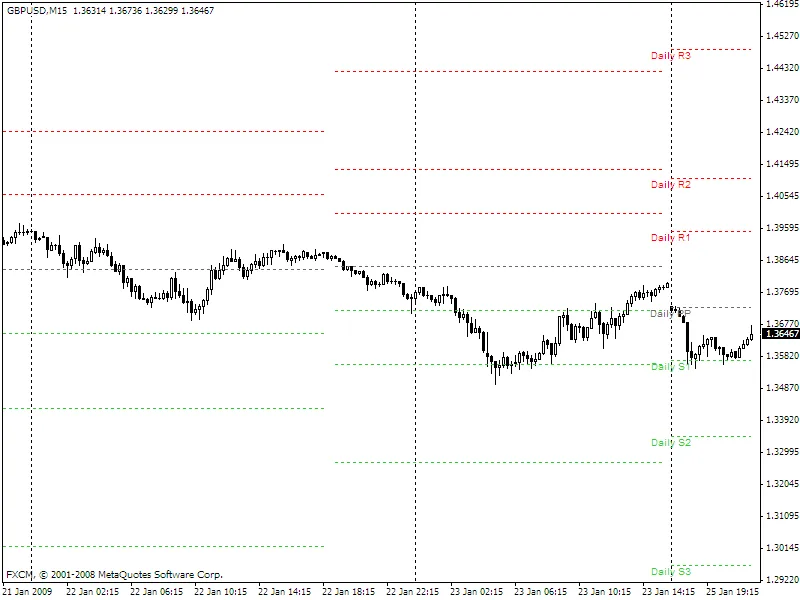
If you're trading and want to gain an edge, understanding daily pivot points is essential. This handy indicator plots horizontal lines at key pivot levels: R3, R2, R1, Pivot, S1, S2, and S3. The twist? It allows you to shift the pivot day to match your preferred trading time zone, which is particularly useful if the server time doesn’t align with your schedule.
This indicator operates by adjusting the pivot day based on the ShiftHrs input, which determines how many hours to shift the day forward or backward. For instance, if your server is set to New York time (GMT-5) but you want your pivot points in London time (GMT), simply set ShiftHrs to +5 (the default setting).
What about the weekend trading? Good question! The indicator doesn't overlook Saturday or Sunday trading, treating any data appearing during these days as part of the preceding or following week. So, if you see data on Saturday, it actually reflects Friday's trading activity, and if it appears on Sunday, it’s from Monday.
Each pivot line uses an indicator buffer, allowing you to keep previous days' pivot levels visible. However, be mindful that due to the limit of 8 buffers, adding intermediate levels like S0.5 or S1.5 isn't feasible.
Labels for the most recent day's levels are displayed, keeping everything clear and straightforward. This indicator can be applied to any chart period, although using daily pivots on longer time frames might not provide much value.
Here's the formula breakdown for your calculations:
- Pivot: (High + Low + Close) / 3
- Range: High - Low
- Resistance 1: 2 * Pivot - Low
- Resistance 2: Pivot + Range
- Resistance 3: Resistance 1 + Range
- Support 1: 2 * Pivot - High
- Support 2: Pivot - Range
- Support 3: Support 1 - Range
As a note, I corrected the calculations for Resistance 3 and Support 3 based on feedback from the community. Thanks for pointing that out!
I’m always open to suggestions for improvements, so feel free to share your thoughts!
Happy trading!
— Jellybean