Calculating the correlation coefficient between two currency pairs can be a game changer for traders. This nifty tool helps you understand the relationship between the price movements of different pairs, making it easier to strategize your trades. When using the correlation indicator, you're comparing the currency pair shown on your chart with another pair specified in the indicator's settings.
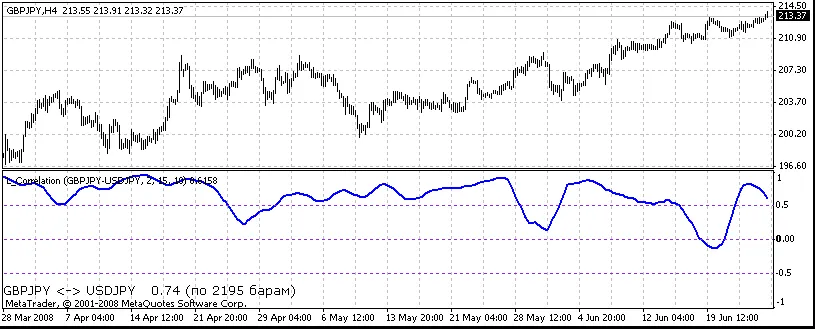
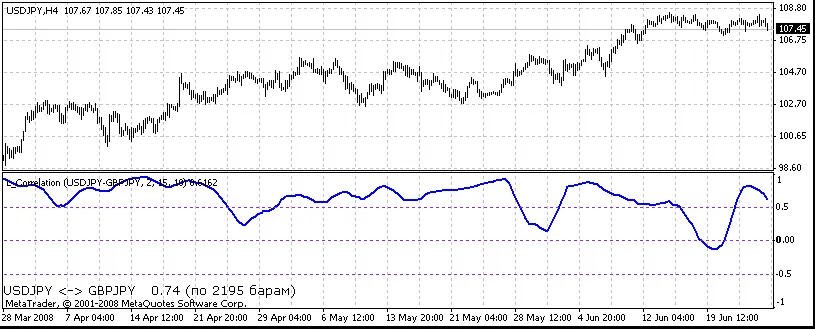
Here's what you'll find displayed in the indicator's window:
- Correlation Coefficient Chart: This visual representation shows you how closely the two pairs are moving in relation to each other. You can choose to hide this chart if it's not your cup of tea.
- Moving Average of the Correlation: Another layer of insight, this moving average tracks the correlation over time, and like the correlation chart, you can toggle its visibility.
- Average Correlation Value: Here, you'll find the average correlation coefficient based on the specified number of recent bars.
Mode Settings: You can select different modes to determine how the correlation is calculated:
- Mode 0: Uses the closing price of the bar.
- Mode 1: Calculates the difference between the opening and closing prices.
- Mode 2: Analyzes the relationship between the closing price and the maximum price of the bar.
When setting up the indicator, you can specify:
- Pair: Enter the currency pair you want to analyze, like "USDCHF" or "EURUSD".
- ShowCorrelation: Set to
trueif you want the correlation buffer displayed, orfalseif not. - ShowMA: Set to
trueto show the moving average buffer, orfalseto hide it. - CorrelationRadius: Define the radius of correlation; the default is 15.
- MA_Period: This sets the period for the moving average, typically at 10.
- ResultingBars: Input the number of bars used to calculate the average correlation coefficient. If you set this to 0, it averages all available values.
You can also customize the appearance of the average correlation value:
- FontName: Choose a font, like "Verdana".
- FontSize: Set your preferred font size, often 10 is standard.
- FontColor: Pick a color for the font, with black being a solid choice.
Utilizing the correlation coefficient indicator can significantly enhance your trading strategy. By understanding how different currency pairs move in relation to one another, you can make more informed decisions and potentially boost your trading success.
Related Posts
- Unlocking MetaCOT 2: Your Ultimate CFTC Indicator Toolkit for MT4
- Unlocking the Power of Master Tools for MetaTrader 4
- Hourly Buffers for Data Collection in MetaTrader 5: A Simple Guide
- Visualize Current Trends Across All Time Frames with This MetaTrader 4 Indicator
- Mastering the Open Range Breakout Indicator for MetaTrader 5