What is Chaikin's Volatility Indicator?
Hey fellow traders! Today, let’s dive into Chaikin's Volatility Indicator (CHV) and how it can shape your trading strategies. This nifty tool helps us gauge the market's ups and downs, and understanding it can give you an edge in your trading game.
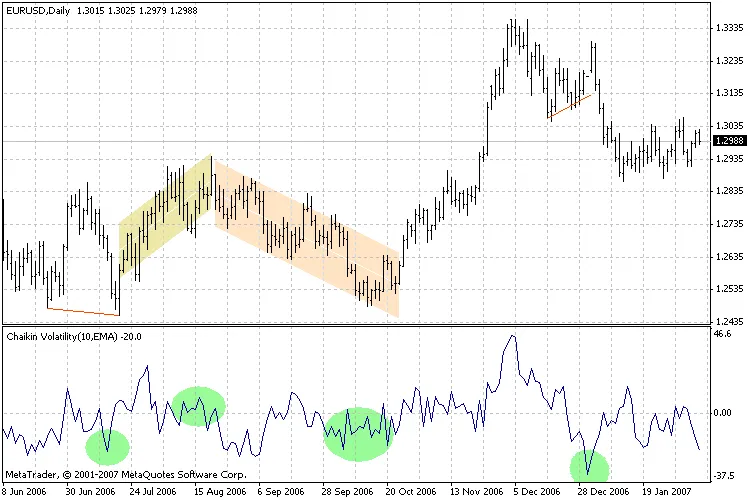
Interpreting Chaikin's Volatility
So, what’s the deal with Chaikin’s interpretation of volatility? According to him, when the volatility indicator spikes in the short term, it often signals that the price is getting close to a base level—think of it as a hint of panic selling, especially in securities. On the flip side, if you notice a drop in volatility over a longer timeframe, it might suggest that we’re nearing a peak. This is particularly relevant in a mature bull market where the excitement is palpable.
Don’t Rely Solely on One Indicator
Now, here’s a crucial tip from Chaikin: don’t put all your eggs in one basket. He advises traders to use a combination of tools. For instance, consider employing a moving average crossover system or trade bands as a way to confirm the signals from the volatility indicator. This multi-faceted approach can help you make more informed trading decisions.
Final Thoughts
In summary, Chaikin's Volatility Indicator is a valuable tool in a trader's toolkit. By understanding its signals and combining it with other indicators, you can enhance your trading strategy and navigate the market with greater confidence. Happy trading!


Comments 0