The Average True Range (ATR) is a key indicator that helps traders gauge market volatility. Developed by Welles Wilder in his classic book, "New Concepts in Technical Trading Systems," ATR has become a staple in many traders' toolkits.
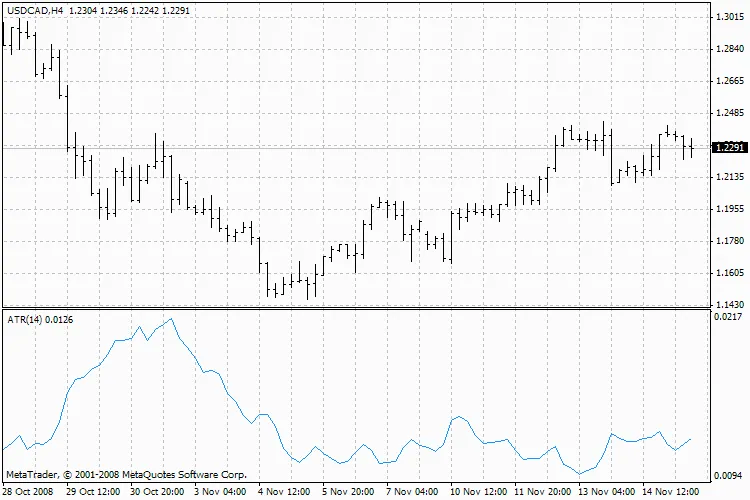
Average True Range, ATR
So, what exactly does ATR tell us? It often spikes at market lows, particularly after a dramatic fall driven by panic selling. Conversely, low ATR values typically occur during extended periods of sideways movement, often seen at market tops or during consolidation phases. Essentially, ATR can be interpreted like other volatility indicators: a higher ATR suggests a greater chance of a trend reversal, while a lower ATR indicates a weaker trend.
How is ATR Calculated?
The calculation of True Range (TR) involves determining the greatest of the following three values:
The difference between the current high and the current low;
The difference between the previous closing price and the current high;
The difference between the previous closing price and the current low.
Once you've calculated the True Range, the Average True Range is simply a moving average of these TR values.
Learn More About ATR
For a deeper dive into the Average True Range and its applications, check out the full description on MetaTrader 5.


Comments 0