Theory:
In the May 2008 issue of TASC, Sylvain Vervoort introduced a compelling trading system in his article, "The Quest For Reliable Crossovers." This approach is built on three key functions: the triple exponential moving average (TMA), the Heikin-Ashi close (haC), and the typical price (TypicalPrice). Vervoort's strategy revolves around trading the crossover of the typical price and Heikin-Ashi TMAs, which can give traders an edge in identifying trends.
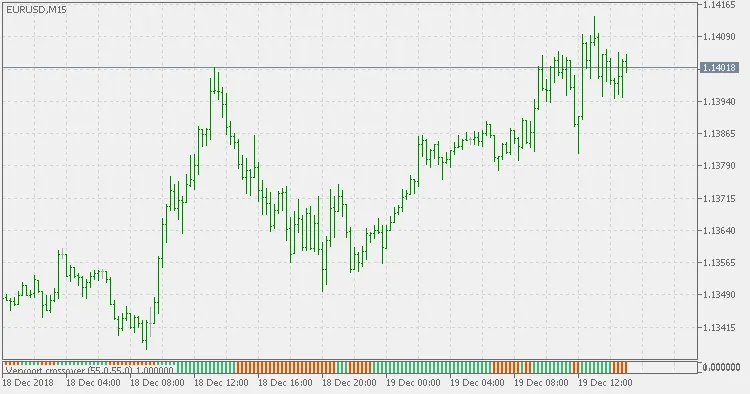
To enhance trend detection, this version of the indicator is designed as a separate window histogram, making it easier to visualize changes in momentum.
Usage:
Keep an eye on color changes within the histogram as potential trading signals. They can be your go-to cues for entering or exiting trades.
Pro Tip:
The Vervort crossover indicator takes into account the lag of the Heikin-Ashi average price. So, if you feel like tweaking your strategy, it's wise to experiment with different periods and price types. To facilitate your experimentation, the full set of Heikin-Ashi prices is provided:
- Heikin-Ashi Close
- Heikin-Ashi Open
- Heikin-Ashi High
- Heikin-Ashi Low
- Heikin-Ashi Median
- Heikin-Ashi Typical
- Heikin-Ashi Weighted
- Heikin-Ashi Average
- Heikin-Ashi Median Body
- Heikin-Ashi Trend Biased Price
Related Posts
- Unlocking MetaCOT 2: Your Ultimate CFTC Indicator Toolkit for MT4
- Unlocking the Power of Master Tools for MetaTrader 4
- Unlock Trading Insights with Volume Profile + Range v6.0 for MetaTrader 5
- Mastering the MACD Candle Indicator for MetaTrader 4
- Visualize Current Trends Across All Time Frames with This MetaTrader 4 Indicator