Discover the Volatility Quality Stridsman Indicator
This unique indicator was developed by Thomas Stridsman, and we’ve kept it true to the original coding—unlike many variations floating around out there.
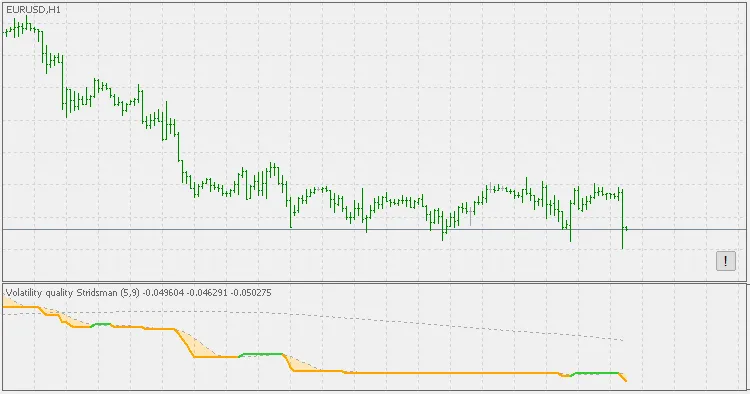
What Does It Plot?
- Fast Average
- Slow Average
- Volatility Quality Line (that colored line you see)
- The zone between the Volatility Quality Line and the Fast Average
The colors of the line and the zone are designed to help you identify the current trend at a glance.
Important Notes:
Keep in mind that the fill color and the slope color of the Volatility Quality Line don’t always match, so watch out for that! The Stridsman version employs the 'slow' average as the main trend indicator. If the Volatility Quality Line is above the slow average, that’s your signal that the trend is up; if it dips below, the trend is down. You can think of the colors of the Volatility Quality Line as short-term fluctuations within the overall trend.
Related Posts
- Unlocking MetaCOT 2: Your Ultimate CFTC Indicator Toolkit for MT4
- Unlocking the Power of Multi-Timeframe Tymen STARC Bands for MetaTrader 5
- Unlocking the Power of Master Tools for MetaTrader 4
- Unlock Trading Insights with Volume Profile + Range v6.0 for MetaTrader 5
- Visualize Current Trends Across All Time Frames with This MetaTrader 4 Indicator