Hey there, fellow traders! Today, I’m excited to share my latest creation: an experimental indicator I developed just for myself. Think of it as your sniper scope for trading rather than a weapon itself. This tool combines several key components: a pip scale, ATR/pivot levels, moving averages (MA), RSI, and a spread alert. While it’s versatile enough to use on any timeframe, it's particularly fine-tuned for scalping on M1 to M15 charts.
Pip Scale
Settings: Scale Zero Level Shift.
The pip scale is pretty straightforward. The zero level is positioned at the midpoint of the selected candle's body. You can tweak this setting to help distinguish between reversals and pullbacks. A good rule of thumb is: if the price is above the zero level, the trend is up. If it's below, the trend is down.
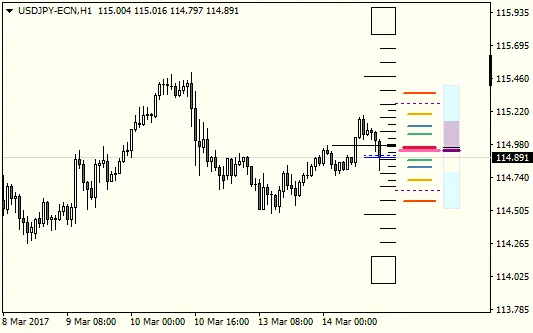
ATR/Pivots
Settings: Mode (Standard, Fibonacci), Period (number of M5 bars), Lines - Style, Color, Width.
This section involves a bit of math. It calculates a weighted average based on the specified number of M5 bars (open, close, high, low prices).
for(int i=1; iThe range is adjusted with ATR from this calculation:
double xATR = iHigh(NULL, ATRTimeFrame, iHighest(NULL, ATRTimeFrame, MODE_HIGH, 5 * N_Bars, 0)) - iLow(NULL, ATRTimeFrame, iLowest(NULL, ATRTimeFrame, MODE_LOW, 5 * N_Bars, 0)); double xRange = (xHigh - xLow) + xATR;This data is crucial for determining pivot levels. These levels will be dynamic based on the ATR value, making the selected period significantly impactful. For intraday trading or scalping, a period of 12 to 288 (representing 1 to 24 hours) is generally a good choice. Just remember, the smaller the number, the more dynamic the levels will be.
MA Level
Settings: Period, Method, Applied Price, Timeframe, Line Color/Style/Width.
The MA level shows the latest price of the moving average from your chosen timeframe. If the level is off the chart, the line gets drawn at the top or bottom, making it longer and thicker. Personally, I use EMA(16) of the typical price on H1 charts, which captures the trend nicely. A good rule of thumb here is: if the price is above the MA level, the trend is up. If it's below, the trend is down.
RSI Indicator
Settings: Period.
This indicator might look a bit tricky at first glance. It’s like viewing the RSI from a different angle. The line represents the current RSI, while the color fill illustrates the last n bars' min/max values (where n is the RSI period). The rule of thumb is: if RSI > 50, the trend is up; if RSI
Spread Alert
Settings: Ratio, Color.
This feature allows you to set a spread and ATR ratio to trigger alerts. When the ratio is hit, it changes the color of the Bid/Ask line and some scale lines to grab your attention. You can enable debug mode to see internal numbers, including the spread, ATR, and % ratio, to help you fine-tune your settings.


Comments 0