Getting to Know the Basics:
The RSI, or Relative Strength Index, is a well-established indicator in the trading world, originally crafted by Welles Wilder. Thanks to its longevity, it’s a go-to tool for many traders. However, it’s not without its quirks; sometimes it throws out false signals depending on market conditions. That’s why many traders like to pair it with additional filters—often focusing on level crossings—to enhance its reliability. This blog post introduces an advanced version that tackles the issue head-on with dual filters.
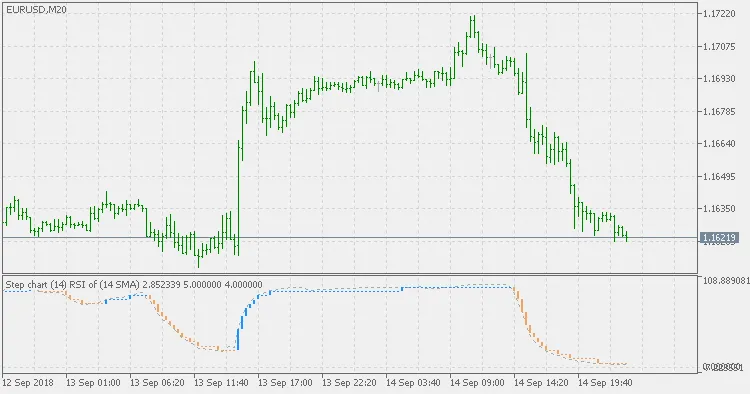
What’s New in This Version:
This revamped version incorporates a step chart as a filter, aiming to reduce the number of signals generated by the RSI. The idea is to make trading simpler and safer. You’ll set a step size based on the RSI percentage you deem significant for filtering minimal changes. Additionally, it can utilize price averages to filter data before it’s fed into the stochastic calculations. This way, you end up with a “double filtered” RSI—filtering the price data first, then applying the step chart filter to the resulting RSI values. The options for averages in this version include:
- Simple Moving Average
- Exponential Moving Average
- Smoothed Moving Average
- Linear Weighted Moving Average
How to Use It:
Keep an eye on the color changes of the step bars; they serve as your trading signals.
Related Posts
- Unlocking MetaCOT 2: Your Ultimate CFTC Indicator Toolkit for MT4
- Unlocking the Power of Master Tools for MetaTrader 4
- Unlock Trading Insights with Volume Profile + Range v6.0 for MetaTrader 5
- Visualize Current Trends Across All Time Frames with This MetaTrader 4 Indicator
- Mastering the MACD Candle Indicator for MetaTrader 4