The Parabolic SAR (Stop and Reverse) is a powerful technical indicator designed for analyzing trending markets. It’s plotted directly on the price chart, similar to a Moving Average but with a key difference: the Parabolic SAR accelerates more quickly and can change positions based on price movement.
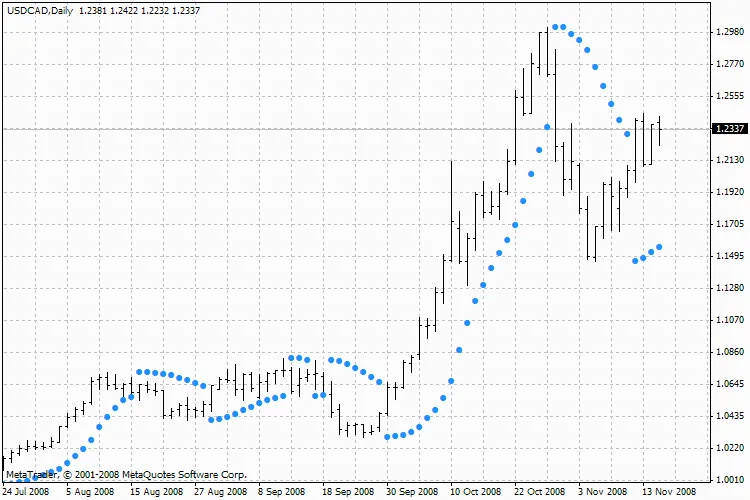
In a bullish market (uptrend), the indicator sits below the price, while in a bearish market (downtrend), it hovers above it. This positioning gives traders a clear visual cue about market momentum.
If the price crosses the Parabolic SAR lines, the indicator flips, and its future values appear on the opposite side of the price. This flip signals a potential end to the current trend, indicating either a correction or a flat market phase.
The Parabolic SAR excels at signaling exit points. If you have a long position, consider closing it when the price dips below the SAR line. Conversely, for short positions, close them when the price climbs above the SAR line. Many traders use this indicator as a trailing stop line to lock in profits.
When you’re in a long position (meaning the price is above the SAR line), the SAR line will continue to rise, no matter the price fluctuations. The speed of the SAR line’s movement is directly tied to the magnitude of price changes.
How to Calculate Parabolic SAR
The formula for calculating the Parabolic SAR is:
SAR(i) = SAR(i-1) + ACCELERATION * (EPRICE(i-1) - SAR(i-1))
Where:
SAR(i-1) — the value of the indicator for the previous bar;
ACCELERATION — the acceleration factor that speeds up the calculation;
EPRICE(i-1) — the highest (or lowest) price from the previous period (EPRICE=HIGH for long positions and EPRICE=LOW for short positions).
The indicator value increases if the current bar’s price exceeds the previous bullish price, and vice versa. As this happens, the acceleration factor also doubles, causing the Parabolic SAR to converge towards the price. Simply put, the more rapidly the price rises or falls, the quicker the indicator aligns with it.
Learn More About Parabolic SAR
For a detailed breakdown, check out the full description of the Parabolic SAR in the Technical analysis: Parabolic SAR.


Comments 0