Understanding the Momentum Indicator
The Momentum Indicator is a powerful tool that measures how much a security's price has shifted over a specific time frame. Traders often leverage this indicator in two primary ways:
First off, you can use the Momentum Indicator as a trend-following oscillator, much like the Moving Average Convergence/Divergence (MACD). The strategy here is straightforward: buy when the indicator hits a low point and starts to rise, and sell when it reaches a peak and begins to fall. For added precision, consider plotting a short-term moving average of the Momentum to help identify those turning points.
If the Momentum Indicator strays into extremely high or low territory—relative to its historical norms—it's often a sign that the current trend will continue. For instance, if it spikes to high levels and then dips, it's likely that prices will keep climbing. Just remember, always wait for price action to confirm the signal from the indicator before making your move (e.g., if prices peak and start to decline, hold off on selling until you see that drop in prices).
Alternatively, you can approach the Momentum Indicator as a leading indicator. This technique operates on the premise that market tops are usually marked by a rapid price surge—when everyone is optimistic and expecting prices to rise—and bottoms often feature swift price declines—when traders are eager to exit. While this can be true, it's worth noting that it's a broad generalization and not a one-size-fits-all rule.
As the market peaks, you'll notice the Momentum Indicator climbing sharply before it falls, creating a divergence from the price's upward or sideways movement. Conversely, at a market bottom, the Momentum Indicator will drop quickly, then start to rise well in advance of price increases. Both scenarios lead to divergences between the indicator and actual prices.
How is Momentum Calculated?
Momentum is calculated as a ratio of today’s price to the price from several periods ago (N periods):
MOMENTUM = CLOSE(i) / CLOSE(i-N) * 100
Where:
- CLOSE(i) — is the closing price of the current bar;
- CLOSE(i-N) — is the closing price N periods back.
Enhancements in This Version
While the standard Momentum Indicator in MetaTrader 4 and MetaTrader 5 is useful, it often lacks the options traders need for more informed decisions. This updated version addresses that gap:
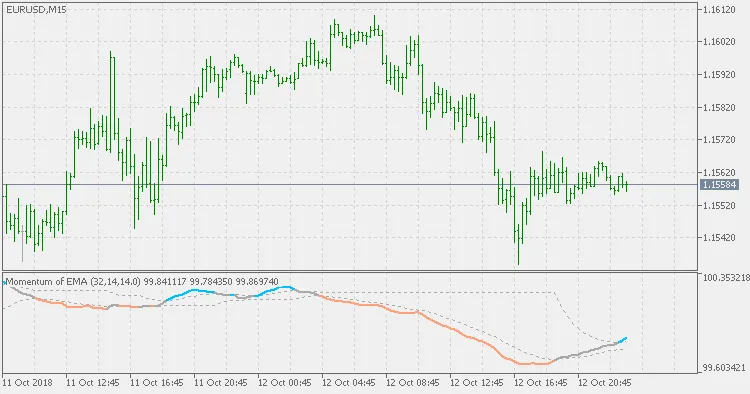
- The indicator can now utilize filtered prices for calculations. This reduces the number of signals (and false signals) significantly when using momentum slope for decision-making. The added lag is minimal and can be easily compared to the built-in Momentum using the same period.
- For this purpose, the indicator offers four types of moving averages for calculation:
- Simple Moving Average (SMA)
- Exponential Moving Average (EMA)
- Smoothed Moving Average (SMMA)
- Linear Weighted Moving Average (LWMA)
- The indicator also includes three color modes:
- Color changes on slope change
- Color changes on the 100% level cross
- Dynamic levels are added to indicate overbought/oversold conditions or the start/end of a trend, providing critical levels beyond just 100%.
- Levels are displayed only if the color change on levels cross is selected (which is the default setting) to keep the Momentum display clear and focused on essential data based on your parameters.
Remember, it's always helpful to compare the “raw” Momentum with this enhanced version to understand the lag and improvements made.

Related Posts
- Unlocking MetaCOT 2: Your Ultimate CFTC Indicator Toolkit for MT4
- Unlock Trading Insights with Volume Profile + Range v6.0 for MetaTrader 5
- Unlocking the Power of Master Tools for MetaTrader 4
- Visualize Current Trends Across All Time Frames with This MetaTrader 4 Indicator
- Mastering the MACD Candle Indicator for MetaTrader 4