Hey there, fellow traders! If you're looking to enhance your trading strategy, let’s dive into the IT indicator, inspired by John Ehlers’ trendline concept.
Understanding the IT Indicator
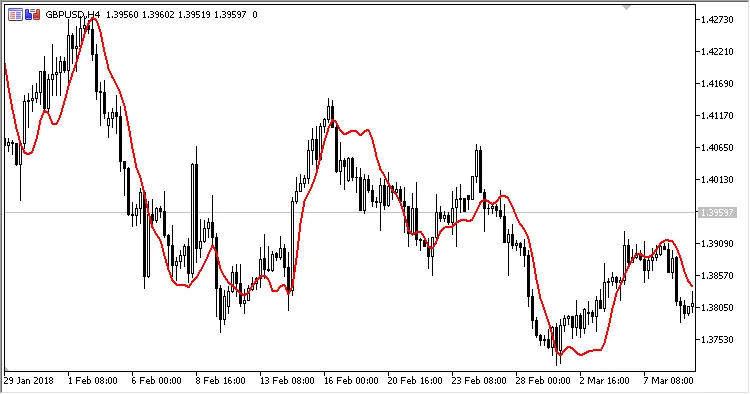
The IT indicator helps you spot trends directly on your price chart, giving you an edge in your trading decisions.
Calculations Behind the Indicator
Here’s how the IT indicator works:
Instantaneous Trendline = MVA(Price, Period) + SmoothSlope / 2
In this formula:
SmoothSlope[i] = (Slope[i] + 2 * Slope[i-1] + 2 * Slope[i-2] + Slope[i-3]) / 6
Slope[i] = Price[i] - Price[i-Period+1]
Using these calculations, you can better understand the market's movement and make more informed trades.
Happy trading, and may your charts always be in your favor!
Related Posts
- Unlocking MetaCOT 2: Your Ultimate CFTC Indicator Toolkit for MT4
- Unlock Trading Insights with Volume Profile + Range v6.0 for MetaTrader 5
- Visualize Current Trends Across All Time Frames with This MetaTrader 4 Indicator
- Mastering the MACD Candle Indicator for MetaTrader 4
- Unlocking the Power of Master Tools for MetaTrader 4