Source of this insight is from the February 2004 edition of Active Trader magazine.
Understanding the Glitch Index System
The Glitch Index system draws inspiration from some of the most effective stock strategies featured in the Trading System Lab. What these strategies have in common is a knack for exploiting minor extreme price movements.
This system identifies when prices stray significantly from their usual range by measuring how far they move above or below a 'detrended' Simple Moving Average (SMA). The indicator derived from this analysis is known as the Glitch Index. This index shows the percentage movement of price above or below the detrended SMA. The underlying theory is that prices will revert to their average, allowing us to profit from these temporary deviations.
The formula for calculating the Glitch Index is as follows:
Where:
Diff = Closing Price - SMAMult
RocSMA = Rate of Change(SMA) * 0.1 + 1
SMAMult = SMA * RocSMA
The system triggers a buy signal when the Glitch Index dips below -2 and prompts a sell when it rises back above +2. However, it avoids entering a long position if the highest Glitch Index reading within a 30-bar period exceeds +5. This precaution helps prevent entering trades when prices are rebounding from an extreme overbought condition, such as during a strong bull run.
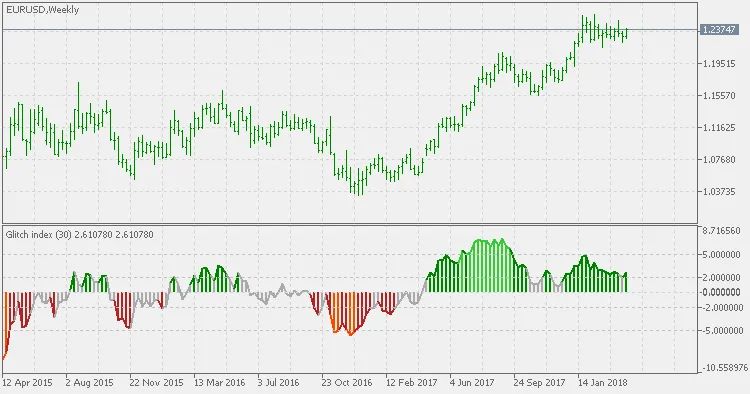
The color coding of the Glitch Index (GI) indicator bars visually represents the system's actions:
- Light green bars: GI greater than 5, indicating that long trades are off-limits for the next 30 bars, even if an entry signal appears.
- Dark green bars: GI above 2 (the sell zone).
- Red bars: Indicate the 'no sell' zone (GI < -5).
- Dark red bars: Represent the buy zone (i.e., GI < -2).
It’s important to note that this system does not engage in short selling.
Entry Criteria
- The Glitch Index must be below -2.
- The highest Glitch Index reading over the last 30 bars needs to be under +5.
- If both conditions are satisfied, buy at market on the next bar.
Exit Strategy
- If the Glitch Index exceeds +2, exit at market on the following bar.
Money Management Guidelines
- Each trade should be sized to represent 6 percent of your current account equity.
This system is tailored for daily and weekly time frames. If you’re looking to apply it to shorter time frames, adjustments to the levels will be necessary.
Related Posts
- Unlocking MetaCOT 2: Your Ultimate CFTC Indicator Toolkit for MT4
- Unlocking the Power of Master Tools for MetaTrader 4
- Visualize Current Trends Across All Time Frames with This MetaTrader 4 Indicator
- Mastering the MACD Candle Indicator for MetaTrader 4
- Hourly Buffers for Data Collection in MetaTrader 5: A Simple Guide