The Extended Regression StopAndReverse indicator is a game changer for traders looking to refine their strategies. This tool builds on some well-known programs, scripts, and expert advisors, bringing a wealth of information to your trading toolkit.
Extended Regression StopAndReverse
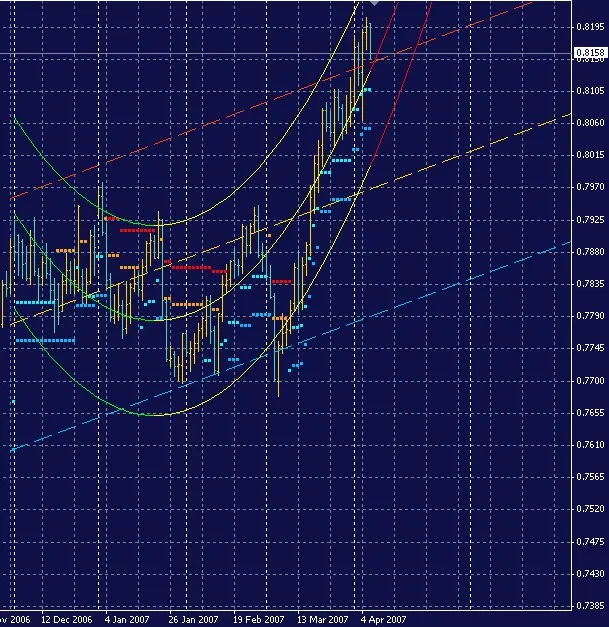
When you fire up this indicator, it automatically assesses the current timeframe, calculating two types of regression and the root-mean-square deviation (RMSD) of prices in the current range. The first thing you'll notice is the straight golden line, which represents the first-degree regression line. This line is crucial as it shows the direction and strength of the current trend. The steeper the angle of this line, the stronger the trend. By analyzing the price's position relative to this regression line, you can draw some insightful conclusions about the currency pair's status.
For instance, if the golden line is sloping upwards and the price is below it, this usually indicates that a minor retracement has just completed, and you can expect the price to move back above the regression line as the trend continues.
The support and resistance lines, which run parallel to the trend, are plotted at a certain distance from the golden line. These lines are determined based on the RMSD value and specific Fibonacci coefficients, serving as valid thresholds for traders.
Using RMSD values and Fibonacci coefficients, the indicator calculates the adaptive "stop" and "stop/reversal" levels for the current price. These levels act as immediate limit values for price deviation within the timeframe of the last bar and are represented by colored dots above and below the price. Blue dots indicate levels below the price, with brighter ones marking "stop" and darker ones indicating "stop/reversal." Conversely, red dots are plotted above the price, showing the stop and reversal levels. It’s important to note that the indicator will only display two of these levels at any given time, simplifying your analysis.
Should the price break through one or both of these stop levels, the indicator will reverse the displayed values. For example, if resistance levels become invalidated, it will display support levels instead. This shift can signal a short-term trend change, giving you the edge in your trading decisions.
Furthermore, the indicator uses a specified regression coefficient to create a non-linear channel that helps forecast short-term price movements while also serving as dynamic support and resistance levels. By default, it employs a parabolic regression coefficient of 2.
Understanding the Indicator Values
Interpreting the indicator values is relatively straightforward:
- When the non-linear regression channel bends and crosses the golden line from above during an uptrend, it's a signal of potential exhaustion—indicating a retracement or even a trend reversal may be on the horizon. A crossing from below suggests an increase in trend strength.
- It's always a good idea to check higher and lower timeframes to get the full picture.
Price Action Around Support and Resistance Lines
When the price moves past resistance during an uptrend, it’s expected to return within the channel, but don't rush to close your positions just yet. If it breaks below support, especially if it breaches both stop/reversal levels, brace yourself for a strong retracement. Always factor in the channel's position relative to the golden line and consider values from adjacent timeframes for a clearer understanding.
All channels are recalibrated and redrawn with every new bar according to the prevailing market conditions. Despite the complex calculations behind it, the indicator operates smoothly without taxing your computer's resources.
Input Parameters
- _RegressionDegree: This sets the degree of non-linear regression, with reasonable values being 2 or 3.
- _K_DeviationChannel: This is the deviation multiplier (not the Fibonacci coefficient!). A typical value is 2, but some traders might find a multiplier of 3 beneficial.
Related Posts
- Unlocking MetaCOT 2: Your Ultimate CFTC Indicator Toolkit for MT4
- Unlocking the Power of Master Tools for MetaTrader 4
- Visualize Current Trends Across All Time Frames with This MetaTrader 4 Indicator
- Unlock Trading Insights with Volume Profile + Range v6.0 for MetaTrader 5
- Hourly Buffers for Data Collection in MetaTrader 5: A Simple Guide