Hey there, fellow traders! Today, let’s dive into a handy tool that can elevate your trading game—the Linear Regression Sketcher for MetaTrader 5.
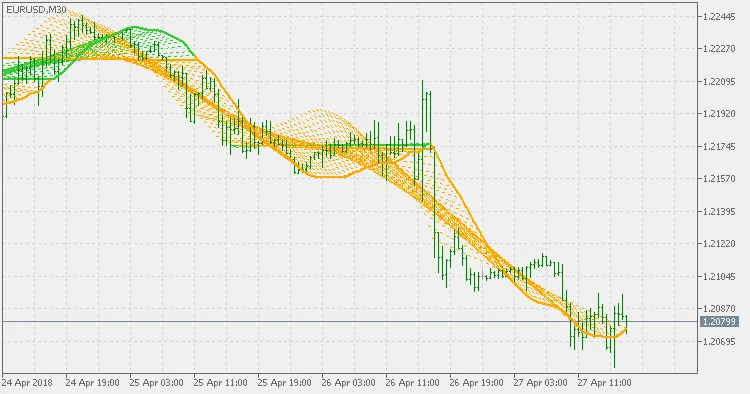
This isn’t just your run-of-the-mill linear regression indicator. Instead of simply displaying the linear regression value, this indicator takes it a step further by illustrating the corresponding linear regression lines. This helps you pinpoint the best linear regression fit and the prevailing trend at any given time and price level.
By using both the linear regression value and its rate of change, you can make more informed trading decisions. It’s like having a crystal ball for your market analysis!
Quick tip: The Linear Regression Sketcher uses objects to draw those helpful regression lines. If you want to run multiple instances of the indicator on the same chart, just make sure to assign a unique ID to each instance. This way, you can customize your analysis without any hiccups!
So, if you’re looking for a way to sharpen your trading strategies, this tool could be just what you need. Give it a whirl, and let’s see those profits roll in!
Related Posts
- Unlocking MetaCOT 2: Your Ultimate CFTC Indicator Toolkit for MT4
- Unlocking the Power of Master Tools for MetaTrader 4
- Visualize Current Trends Across All Time Frames with This MetaTrader 4 Indicator
- Mastering the Open Range Breakout Indicator for MetaTrader 5
- Mastering the Waddah Attar Trend Alert Indicator for MetaTrader 5