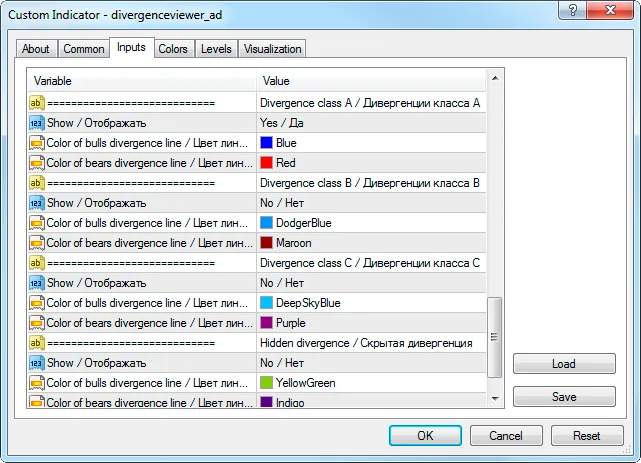
Divergence detection can be a game-changer in your trading strategy. With the right indicator, you can spot potential price reversals by visualizing divergences directly on your charts. This indicator showcases these divergences through two synchronized lines: one on your price chart and another on the indicator chart. It supports four classes of divergences, allowing you to toggle the visibility of each class and choose the colors for bullish and bearish divergence lines.
This tool includes six standard indicators such as RSI, MACD, Momentum, RVI, Stochastic, and Standard Deviation, which serve as the primary data sources for identifying divergences against price movements (referred to as the base indicator). Additionally, it can work with two custom indicators: Derivative and William Blau.
You can adjust the parameters of the base indicator in the input parameter section:
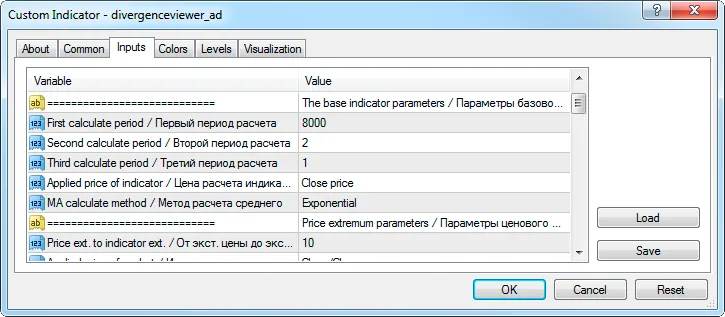
Make sure to set the parameters in the order they appear in the standard indicator. For example, when using Stochastic as your base indicator, the settings should be as follows:
- "The first calculation period" — %K,
- "The second calculation period" — %D,
- "The third calculation period" — slowing.
If your base indicator has fewer than three parameters, simply ignore the missing ones. For instance, when using RSI or Momentum, you only need to set two parameters: "The first calculation period" and "Indicator calculation price."
If you want to use a different indicator as your base, select "Custom" in the "Base indicator" parameter and fill out the following fields in the "Custom indicator" section:
- "Indicator name" — the name of the indicator as it appears in the terminal's "Navigator" window, without the extension.
- "Index of the buffer for data pickup" — the index for the indicator line used for plotting the base indicator chart (usually 0).
- "Number of the indicator parameters" — specify how many input parameters the indicator uses. Set it to 0 to use the default values.
- "Value of the N-th parameter" — enter the corresponding values for the base indicator parameters.
After configuring your base indicator, you'll need to set the maximum length for the divergence by adjusting the "Depth of the 2-nd support point lookup" parameter. Additionally, define how closely the price extremums should align with the indicator extremums using the "From price extremum to indicator extremum" parameter.
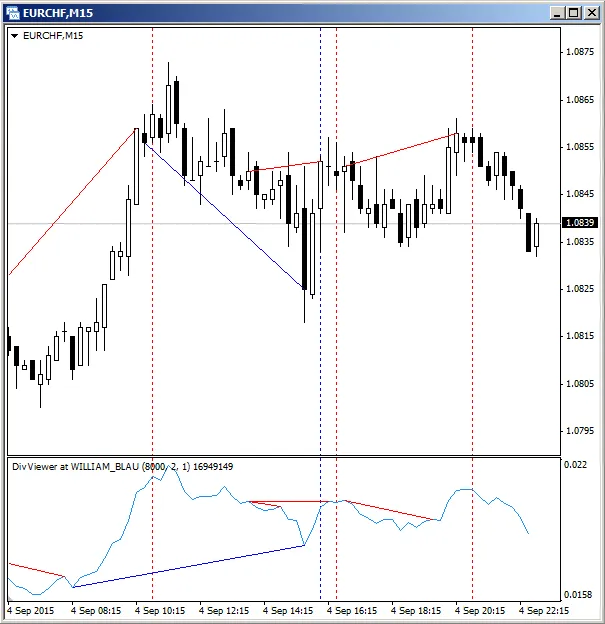
Divergence registration relies on identifying local extremums. To form any extremum, you'll need at least three bars, with the central bar being the extremum. This means that divergence registrations occur with a two-bar delay. The example below illustrates class A divergences and highlights the bars marked with vertical lines (these lines are not part of the indicator) that indicate where divergences are registered.
For a complete overview of what this indicator can do and how it works, check out the article on Divergences on the Current Chart.
Related Posts
- Unlocking MetaCOT 2: Your Ultimate CFTC Indicator Toolkit for MT4
- Visualize Current Trends Across All Time Frames with This MetaTrader 4 Indicator
- Unlocking the Power of Master Tools for MetaTrader 4
- Unlock Trading Insights with Volume Profile + Range v6.0 for MetaTrader 5
- Mastering the MACD Candle Indicator for MetaTrader 4