Hey fellow traders, let’s dive into nonlinear regression and see how it can elevate your trading game.
Understanding Nonlinear Regression
First off, nonlinear regression is a method used to analyze data by fitting it to a model represented as a mathematical function. Unlike simple linear regression, which connects two variables (X and Y) with a straight line (think of it as y = mx + b), nonlinear regression creates a curve that can adapt to the randomness in the data. The ultimate goal? To minimize the sum of squares, which measures how much the observations deviate from the mean.
So how does this work? The sum of squares is calculated by taking the difference between the mean and each data point, squaring those differences, and adding them all up. The lower this sum, the better the model fits the data points. Nonlinear regression can employ various fitting methods, including logarithmic, trigonometric, and exponential functions.
Using the Nonlinear Regression Indicator in MetaTrader 5
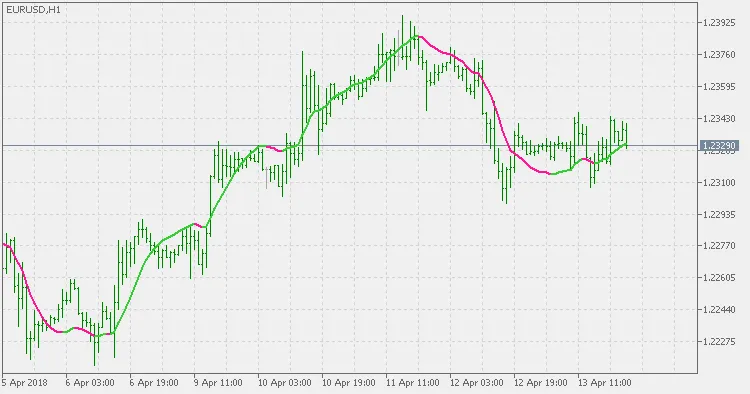
This indicator is specifically designed for MetaTrader 5 and is known for its quick response to sudden market shifts. It’s worth noting that the default calculation period is set longer than what you might typically find in other indicators. This is intentional, as it helps smooth out volatility. However, I’d recommend experimenting with the period settings to find what works best for your trading strategy and style.
Incorporating nonlinear regression into your trading toolkit can provide you with valuable insights. Give it a try and see how it fits within your trading approach!
Related Posts
- Unlocking MetaCOT 2: Your Ultimate CFTC Indicator Toolkit for MT4
- Visualize Current Trends Across All Time Frames with This MetaTrader 4 Indicator
- Unlocking the Power of Master Tools for MetaTrader 4
- Mastering the MACD Candle Indicator for MetaTrader 4
- Hourly Buffers for Data Collection in MetaTrader 5: A Simple Guide