As traders, we’re always on the lookout for tools that can give us an edge, and the Volume Rate of Change (VROC) indicator is one of those gems, especially now that we can utilize real volumes provided by our brokers.
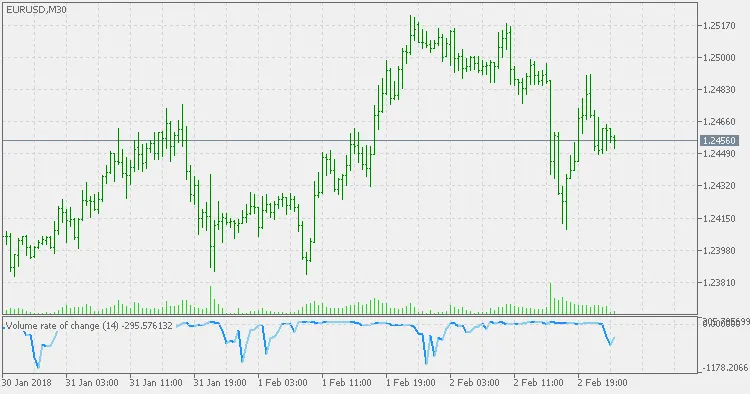
The VROC indicator measures the rate at which volume changes over a set number of trading sessions—let’s say, the last 'n' sessions. In simple terms, it compares the current volume to what it was 'n' periods ago, offering insights into market dynamics.
This indicator can be a game-changer in your trading arsenal. When you notice a spike in the rate of change, it’s a good idea to check it against key technical support and resistance levels or combine it with other price-based indicators. This can give you a clearer picture of where the market might be headed.
In essence, the VROC can help forecast whether those pivotal support and resistance levels are likely to hold or break. It’s also a reliable way to confirm existing trends.
The Volume Rate of Change isn’t just a standalone tool; it fits into various trading strategies that leverage its insights for better decision-making.
Spotting Fake Market Moves with VROC
One of the most popular uses of the VROC indicator is identifying fake breakouts. When an asset hits a new high, we typically expect volume to rise, which validates the breakout and signals increased interest among traders.
However, if you notice that volume isn’t supporting that new high, it could be a sign that a price correction is on the horizon. This insight can save you from falling into a common trap of chasing false moves.
Related Posts
- Unlocking MetaCOT 2: Your Ultimate CFTC Indicator Toolkit for MT4
- Unlocking the Power of Master Tools for MetaTrader 4
- How to Use the Change Chart Symbol Menu for MetaTrader 4
- Mastering the Open Range Breakout Indicator for MetaTrader 5
- Maximize Your Trading Potential with the ColorX2MA_Alert Indicator for MetaTrader 5