Hey fellow traders! Today, I want to dive into an intriguing indicator for MetaTrader 4 that can really sharpen your trading strategy: the Fractal Lines indicator. Inspired by B. Williams' book, "Chaos," I had the idea to move beyond the traditional "squat" bar and focus on the "squat" fractal. Here’s how it works:
Understanding the Squat Fractal
We're looking at two nearby divergent fractals. The first fractal, which is further back in history, trends downward, while the second one, closer to the present, trends upward. To analyze these fractals, we'll calculate:
- Delta of the Fractal: This is calculated using the formula:
(High[i+2] - Low[i+2] + High[i+1] - Low[i+1] + High[i] - Low[i] + High[i-1] - Low[i-1] + High[i-2] - Low[i-2])
(Volume[i+2] + Volume[i+1] + Volume[i] + Volume[i-1] + Volume[i-2])
(delta / total volume)
Next, we apply the same process to the second fractal. If the following condition holds:
(MFI1 > MFI2 && Vol1 < Vol2) == true;
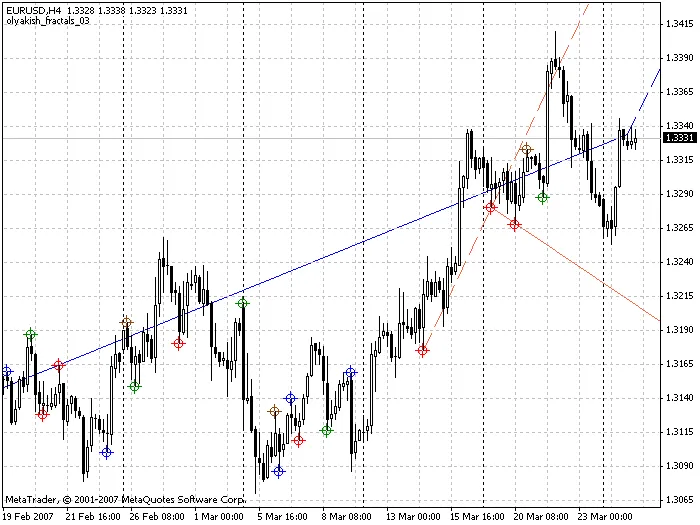
We draw a dot above the high of this fractal. The resistance line is then the trend line connecting two adjacent upward "squat" fractals. For pairs of fractals moving in opposite directions, we draw the dot below the low of the downward "squat" fractal, with the resistance line drawn across two adjacent downward fractals.
Trading Strategy with Fractal Lines
This trading system is still a work in progress, but here are some initial thoughts:
- If the support line (brown) is sloping upwards and the price is above it, wait for the price to close below this line before selling.
- If the support line is sloping downwards and the price breaks above it, hold off on entering a trade.
It's the opposite for trading support line breakouts. Remember, this is just a starting point!
Feedback Welcome!
I’d love to hear your thoughts on improving both the indicator and the trading system!
Updates:
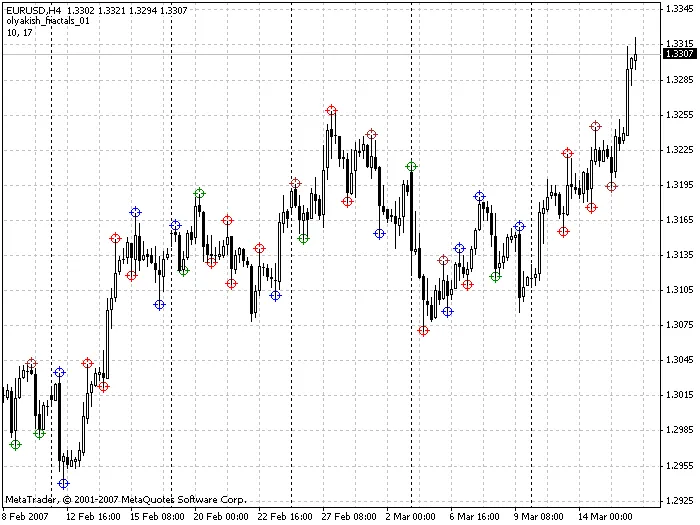
15.03.2007: Added the olyakish_fractals_01.mq4 indicator to display additional fractals, including "green," "squat," "false," and "fading."
22.03.2007: Introduced the new olyakish_fractals_02.mq4 version, which filters fractals based on their inner volume (as a percentage). This will help to reduce the number of fractals displayed, highlighting only the most significant ones.
Trading Strategy: Focus on trading the breakout of the red fractals (squat) and consider trading in the opposite direction when a blue (false) fractal emerges, setting your Stop Loss on the current fractal. This strategy can help you capture movements from just a few pips to significant trends.
27.03.2007: Released olyakish_fractals_03.mq4 with features to plot current support/resistance lines and the option to enable/disable previous lines. This indicator is quite sensitive to tick volume, so ensure you're working with quotes that are as close to real-time as possible.
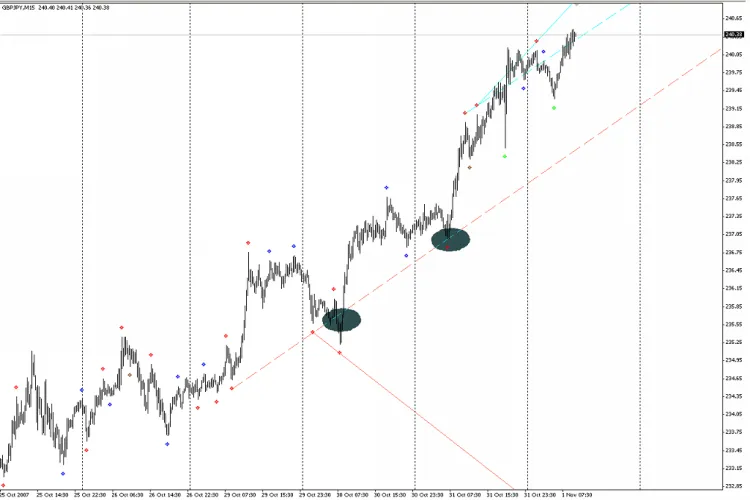
01.11.2007: Added a feature to select the number of bars in a fractal and choose the fractal type for drawing support/resistance lines. My take is that if the support line is rising and the price touches it and then bounces back, or briefly breaks it and closes above the line, the upward movement is likely to continue (trade with the trend). The same principle holds for resistance lines.
26.11.2007: Addressed some bugs in version 06a.
Related Posts
- Unlocking MetaCOT 2: Your Ultimate CFTC Indicator Toolkit for MT4
- Visualize Current Trends Across All Time Frames with This MetaTrader 4 Indicator
- Unlocking the Power of Master Tools for MetaTrader 4
- Unlock Trading Insights with Volume Profile + Range v6.0 for MetaTrader 5
- Maximize Your Trading Potential with the ColorX2MA_Alert Indicator for MetaTrader 5