Technical Indicator

Mastering the FE Fibonacci Expansion Indicator for MetaTrader 4
MetaTrader4
Mastering the FE Fibonacci Expansion Indicator for MetaTrader 4

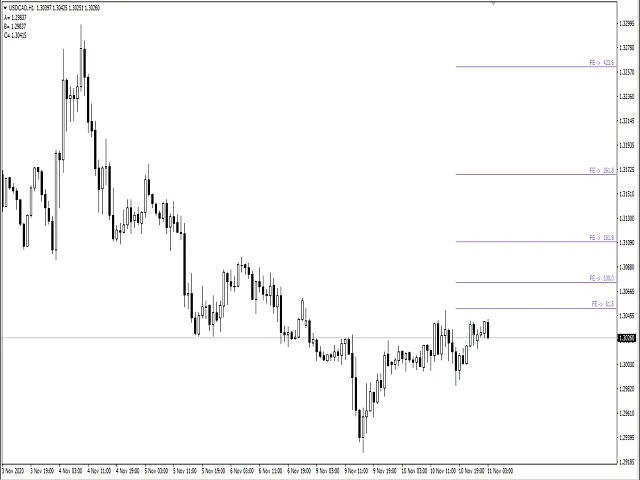
Hey there, fellow traders! Today, I’m excited to share with you my creation: the FE Fibonacci Expansion indicator for MetaTrader 4. This nifty tool is designed using two objects in an array that represent properties for two directions: UP and DOWN. How It Works Let's break it down. Each direction will have three prices: A, B, and C, which correspond to the upper, lower, and mid-range prices. The variables aa, bb, and cc indicate the bar locations for their respective prices. class FEExpansion{   public:     int aa, bb, cc;     double A, B, C;     FEExpansion():       aa(0), bb(0), cc(0),       A(0.0), B(0.0), C(0.0)   {}   ~FEExpansion() {}} P[2]; Each direction is determined using a fractal formula with a bit of tweaking to pinpoint the three key points: upper, lower, and a price in between, all along with their directions. Looping Through Bars Here’s how I loop through the recent bar locations: //---  int i=0;  int m=0, n=0;  bool stop=false;  double hi=0.0, lo=0.0;//---  A=0.0;  B=0.0;  C=0.0;  for(m=0, n=0, i=0; i<Bars-5&&!stop; i++)     {      hi=(            iHigh(_Symbol,0,i+2)>=iHigh(_Symbol,0,i+0) &&            iHigh(_Symbol,0,i+2)>=iHigh(_Symbol,0,i+1) &&            iHigh(_Symbol,0,i+2)>=iHigh(_Symbol,0,i+3) &&            iHigh(_Symbol,0,i+2)>=iHigh(_Symbol,0,i+4))         ?iHigh(_Symbol,0,i+2):0.0;      lo=(            iLow(_Symbol,0,i+2)<=iLow(_Symbol,0,i+0) &&            iLow(_Symbol,0,i+2)<=iLow(_Symbol,0,i+1) &&            iLow(_Symbol,0,i+2)<=iLow(_Symbol,0,i+3) &&            iLow(_Symbol,0,i+2)<=iLow(_Symbol,0,i+4))         ?iLow(_Symbol,0,i+2):0.0;      //---      //---      //--------------------------------------------------------------------------------------------------------------------      //--------------------------------------------------------------------------------------------------------------------      if(hi!=0.0)// ------------up------------      {         if(P[1].C!=0.0)           {            if(n==2)              {                if(P[1].B<hi&&P[1].C<P[1].B)                 {                  P[1].B=hi;   //this modify B[1] before A[1] exist                P[1].bb=i+2;              }            if(n==1)              {                if(P[1].C<hi)                 {                  P[1].B=hi;   //this B[1] dn                  P[1].bb=i+2;                  n++;                 }                else                 {                  n--;                  P[1].C=0.0;                 }              }      }      //---      if(P[0].C==0.0)       {        if(m<1)          {            P[0].C=hi;   //initial C[0] up            P[0].cc=i+2;            m++;          }      }      else       {        if(m==2)          {            if(P[0].C<hi)                 {                P[0].A=hi;   //this A[0] up                P[0].aa=i+2;                m=0;                stop=true;                 }              }            if(m==1)          {            if(P[0].C<hi)                 {                P[0].C=hi;   //this modify C[0] before B[0] exist                P[0].cc=i+2;                 }              }      }      //---      }      //else      if(lo!=0.0)// ------------dn------------      {         if(P[0].C!=0.0)       {            if(m==2)              {                if(P[0].B>lo&&P[0].C>P[0].B)                 {                  P[0].B=lo;   //this modify B[0] before A[0] exist                P[0].bb=i+2;                 }              }            if(m==1)          {            if(P[0].C>lo)                 {                  P[0].B=lo;   //this B[0] up                  P[0].bb=i+2;                  m++;                 }                else                 {                  m--;                  P[0].C=0.0;                 }              }      }      //---      if(P[1].C==0.0)       {        if(n<1)          {             P[1].C=lo;   //initial C[1] dn             P[1].cc=i+2;             n++;              }      }      else       {        if(n==2)          {               if(P[1].C>lo)                 {                  P[1].A=lo;   //this A[1] dn                  P[1].aa=i+2;                n=0;                stop=true;                 }              }            if(n==1)              {               if(P[1].C>lo)                 {                  P[1].C=lo;   //this modify C[1] before B[1] exist                P[1].cc=i+2;                 }              }      }      }      //---      }      //else      //      //---      //---      //---      if((P[0].C==0.0&&P[1].C==0.0)||(hi==0.0&&lo==0.0))        {         continue;        }      }// loop If the loop finds three points indicating either an upward or downward direction, it breaks out of the loop. Finalizing the Expansion Now, let’s pull out the three points:   if(P[0].A!=0.0&&P[0].B!=0.0&&P[0].C!=0.0)     {      DrawExpansion(tool,"FE ->",Time[P[0].aa],P[0].A,Time[P[0].bb],P[0].B,Time[P[0].cc],P[0].C,-1);     }//---  if(P[1].A!=0.0&&P[1].B!=0.0&&P[1].C!=0.0)     {      DrawExpansion(tool,"FE ->",Time[P[1].aa],P[1].A,Time[P[1].bb],P[1].B,Time[P[1].cc],P[1].C,1);     } Finally, we use the OBJ_EXPANSION object to draw our expansion with a single function call, DrawExpansion(...). void DrawExpansion(string name,string label,datetime t1,double p1,datetime t2,double p2,datetime t3,double p3,int fl=0){  //---   ObjectDelete(name);   color wrn=(fl>0)?clrSkyBlue:(fl<0)?clrTomato:clrWhite;   if(ObjectFind(0,name)!=0)      ObjectCreate(name,OBJ_EXPANSION,0,t1,p1,t2,p2,t3,p3);   ObjectSet(name,OBJPROP_FIBOLEVELS,5);   ObjectSet(name,OBJPROP_FIRSTLEVEL+0,0.618);   ObjectSet(name,OBJPROP_FIRSTLEVEL+1,1.000);   ObjectSet(name,OBJPROP_FIRSTLEVEL+2,1.618);   ObjectSet(name,OBJPROP_FIRSTLEVEL+3,2.618);   ObjectSet(name,OBJPROP_FIRSTLEVEL+4,4.236);   //---   ObjectSet(name,OBJPROP_LEVELCOLOR,clrMediumPurple);   ObjectSet(name,OBJPROP_LEVELWIDTH,1);   ObjectSet(name,OBJPROP_LEVELSTYLE,0);   ObjectSet(name,OBJPROP_COLOR,wrn);   //---   ObjectSetFiboDescription(name,0,label+"  "+DoubleToStr(0.618*100,1

2020.11.11
Maximize Your Trading with Fibo Bars 3 for MetaTrader 4
MetaTrader4
Maximize Your Trading with Fibo Bars 3 for MetaTrader 4

Have you heard about the Fibo Bars 2? It’s an awesome indicator developed by Ivan Karnilov, and it got me thinking about how we can take it up a notch. Enter Fibo Bars 3, which combines multiple Fibo Bars 2 indicators into one powerful tool! So, what’s the idea behind it? Well, Fibo Bars 3 uses a larger time frame as a primary trend, while incorporating two smaller periods. When the colors of the two smaller periods align with the color of the larger period, you’re in the green! However, the moment one of those smaller periods flips to a different color, the indicator turns yellow, signaling that the market may be moving against the main trend. Key Features: Period: The larger the set period value, the less reactive the indicator will be. Fibo Level: Set your correction levels as follows: Level 1: 0.236 Level 2: 0.382 Level 3: 0.5 Level 4: 0.618 Level 5: 0.762 When you choose a fiboLevel in Fibo Bars 3, it applies uniformly across all Fibo Bars 2 layers, making it super convenient. To tailor the indicator to your trading style and time frames, start by analyzing the initial Fibo Bars 2, which will serve as your primary trend reference. From there, check the lower Fibo Bars 2 periods to decide what corrections you want to focus on and identify your reversal points. The settings are highly customizable! If you pair Fibo Bars 3 with oscillators, you can pinpoint even earlier entry points. You can choose to hold a trade until the oscillator signals overbought/oversold conditions, or until that yellow color pops up again on Fibo Bars 3. If you’ve discovered any cool strategies or examples using this indicator, don’t keep it to yourself! I’d love to hear about them!

2020.11.02
Mastering the MACD Indicator for MetaTrader 4: Your Guide to Trading Success
MetaTrader4
Mastering the MACD Indicator for MetaTrader 4: Your Guide to Trading Success

Understanding the MACD Indicator The MACD indicator is a powerful tool for traders looking to enhance their decision-making process. It provides a clear visual representation of price movements, helping you spot potential trading signals more effectively. How to Use MACD for Better Trading Decisions When the MACD line crosses the signal line, or if the MACD line is positioned above or below the signal line, it can indicate significant market movements. Observing the current price alongside the MACD (represented by the blue line) helps confirm these signals, reducing the chance of false alarms. Flexibility Across Time Frames You can apply the MACD indicator to any time frame, making it a versatile choice for both intraday trading and longer-term trend analysis. Identifying Trading Zones There are various ways to interpret the MACD readings. For instance, if the MACD is above zero and the price is positioned contrary to the signal line, with a downward cross, this typically signals a sell opportunity. Conversely, the opposite is true for buy signals. Warning Signals If you notice the MACD crossing the signal line but the price isn’t moving as expected, it’s a red flag. This could indicate that a significant price movement is just around the corner, so be cautious! Incorporating MACD into Your EA I often utilize the MACD indicator in my trading systems (EAs) for even better results. Let's Chat! If you have any questions or want to share your thoughts on using the MACD indicator, feel free to drop a comment or suggestion below!

2020.10.28
Mastering the MA of WPR: A Key Indicator for MetaTrader 4
MetaTrader4
Mastering the MA of WPR: A Key Indicator for MetaTrader 4

Understanding the MA of WPR If you're trading on MetaTrader 4, you’ve likely come across the MA of WPR (Moving Average of the Williams Percent Range) indicator. It’s a powerful tool that can help you identify potential entry and exit points in the market. Why Use the MA of WPR? The MA of WPR is an excellent way to smooth out the volatility of the WPR, making it easier to spot trends. Here are a few reasons why you might want to incorporate this indicator into your trading strategy: Trend Confirmation: It can help confirm the direction of the trend, providing additional confidence in your trades. Overbought/Oversold Signals: The MA of WPR can indicate when an asset is overbought or oversold, which are critical signals for traders. Versatility: Works well across various time frames, giving you the flexibility to trade based on your style. How to Set It Up on MetaTrader 4 Setting up the MA of WPR on MT4 is straightforward. Here’s a quick guide: Open your MetaTrader 4 platform. Go to the "Insert" menu, then select "Indicators" and choose "Custom" to find the MA of WPR. Adjust the parameters to suit your trading strategy, such as the period for the moving average. Click "OK" and watch how it enhances your trading experience! Final Thoughts The MA of WPR is a fantastic addition to any trader’s toolkit. By providing clearer signals and smoothing out market noise, it can help you make more informed trading decisions. Don’t hesitate to give it a try and see how it works for you!

2020.09.21
Maximize Your Trading Potential with the Actual Volatility Scanner for MetaTrader 4
MetaTrader4
Maximize Your Trading Potential with the Actual Volatility Scanner for MetaTrader 4

Description: When it comes to trading, volatility is your best friend. No price movement means no profit - and certainly no loss! The Actual Volatility Scanner indicator displays horizontal bars that represent candle bodies based on a selected index (TrackedCandleIndex). Each candle body's size is compared to its average size (CandleAverageNumber), providing a clear visual representation of market activity. For example: In the image above, the CADCHF pair shows significant volatility with a value of 221%. This indicates that the current candle body is over two times larger than the average body for CADCHF on the current timeframe. Conversely, the GBPAUD pair is displaying low volatility, with its body size only 5% of its average, signaling a lack of movement. Within the indicator window, you can customize the following settings: TextSize, ReferenceBody - specifies the length of the body bars, CandleAverageNumber, TrackedCandleIndex - where zero (0) represents the current candle, one (1) the candle from one period ago, and so forth, HorizontalStartPosition - determines how far from the right edge the indicator will be displayed. You can even place multiple instances of the indicator on a single chart to get a more comprehensive view of the price landscape. If you add another instance for a different candle index, just remember to adjust the HorizontalStartPosition to avoid any overlap. Usage: Monitoring actual volatility: Low volatility can indicate a consolidation phase, which often precedes larger price movements. Conversely, if a very large candle appears, it’s less likely that a similarly large candle will follow. Correlation analysis: The image above illustrates a strong price movement across all three American indices one timeframe back, showcasing their high correlation. In contrast, pairs involving EUR demonstrate very low volatility, while pairs with CHF exhibit strong movements.

2020.09.06
First Previous 7 8 9 10 11 12 13 14 15 16 17 Next Last