Description:
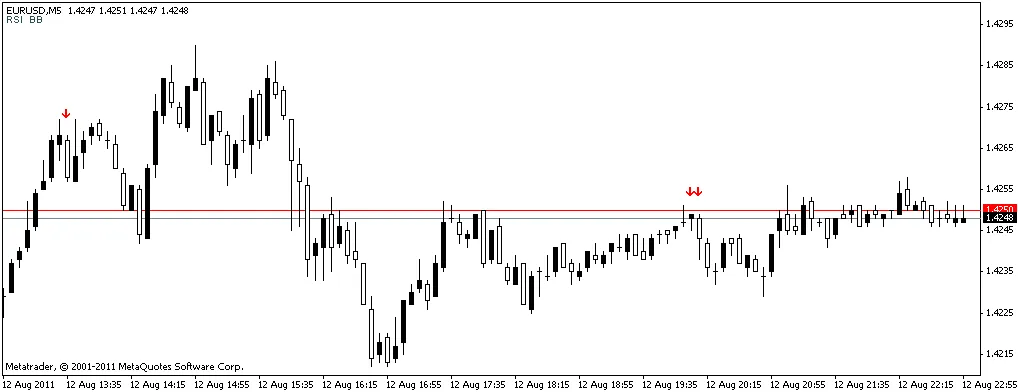
If the price breaks through the upper or lower Bollinger Bands®, and the RSI is showing overbought or oversold conditions while pulling back to the 50 mark, that’s your cue for a potential trade signal.
Sure, there will be some false signals here and there, but like always, proper money management and tight stop-losses are your best friends. The recommended timeframe for using this indicator is M5. I’ve even added a few tools to help you prep for a signal.
The RSI object will turn orange when it's in overbought or oversold territory, and it will switch to green or red when it heads back toward the 50 level. Likewise, the Bollinger Bands object will change to red or green when a band gets pierced.
If you spot a higher high or a lower low following a buy or sell signal without a new signal appearing, watch for a divergence in the RSI. You know what that implies! ;)
Happy pipping!
Related Posts
- Unlocking MetaCOT 2: Your Ultimate CFTC Indicator Toolkit for MT4
- Mastering the FE Fibonacci Expansion Indicator for MetaTrader 4
- Understanding the Welch Bollinger Band Width Indicator for MetaTrader 4
- Visualize Current Trends Across All Time Frames with This MetaTrader 4 Indicator
- Unlock Trading Insights with Volume Profile + Range v6.0 for MetaTrader 5