Gain/Loss Info Indicator for MetaTrader 4 — This handy tool lets you track gains and losses for all candles that exceed a certain threshold. It calculates values in both points and percentage, giving you a clear picture of your trades.
How It Works
The indicator can operate in two modes: it can compare the Close and Open prices of candlesticks or measure the difference between the current Close and the previous Close. You have the flexibility to set minimum change limits in pips and percentage, choose different modes, and customize the font color for the output numbers. Plus, it’s compatible with both MT4 and MT5 platforms!
Input Parameters
- PercentageLimit (default = 1.0) — This sets the minimum threshold for changes to be displayed, measured in percentage points.
- PointsLimit (default = 1000) — This defines the minimum threshold for changes to be shown, measured in points.
- CloseToClose (default = true) — If set to true, the indicator compares the current Close to the previous Close; if false, it compares the current Close to the current Open.
- DisplayLossColor (default = clrRed) — This sets the color for displaying negative price changes.
- DisplayGainColor (default = clrGreen) — This sets the color for displaying positive price changes.
- MaxBars (default = 100) — This limits the maximum number of bars the indicator will calculate on. Keep in mind, the higher this number, the more lag the indicator may experience.
- FontFace (default = "Verdana") — This determines the font for the display.
- FontSize (default = 10) — This sets the font size for the display.
- ObjectPrefix (default = "GLI-") — This prefix is used for chart objects to ensure compatibility with other indicators.
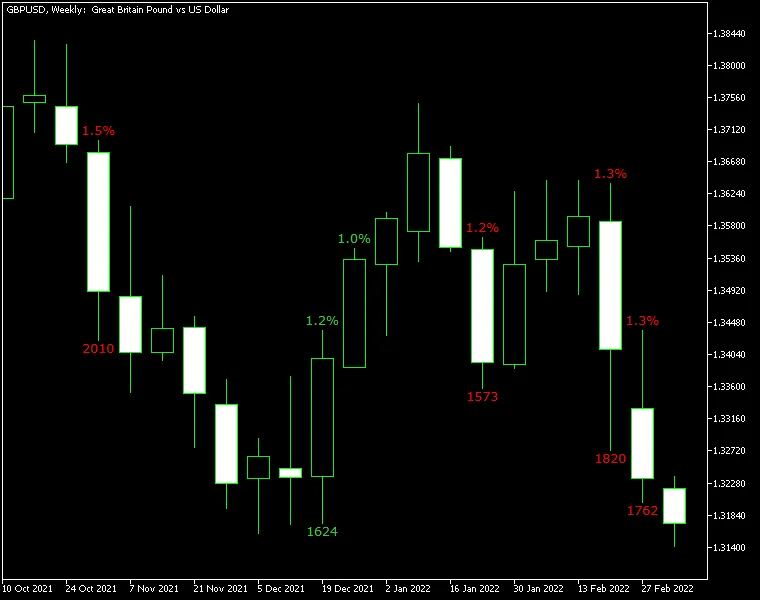
The chart above illustrates the Gain/Loss Info indicator applied to GBP/USD on a weekly basis. With a percentage limit set at 1.0% and a pips limit of 1,500, the calculation mode was adjusted to "Close vs. previous Close." The points count for the period can be seen below the candles, while the percentage changes are displayed above them.
Now, let’s be clear: while this indicator isn’t designed for generating trading signals, it does a great job of simplifying market analysis. It helps you spot bullish and bearish patterns more easily. You can certainly use it to identify significant changes that might signal potential entry or exit points.


Comments 0