MetaTrader5
MAMACD: A Game-Changer for MetaTrader 5 Traders
Idea Contributor: Yuri, Code Author: barabashkakvn.
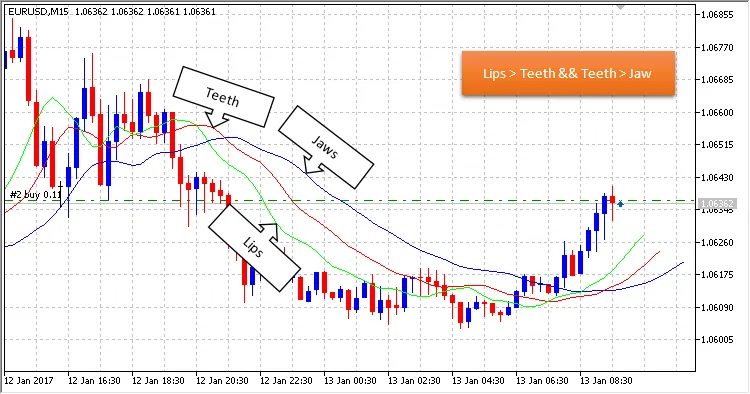
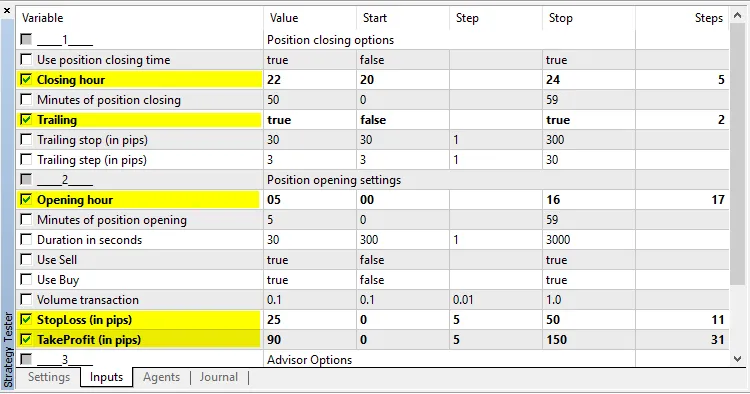
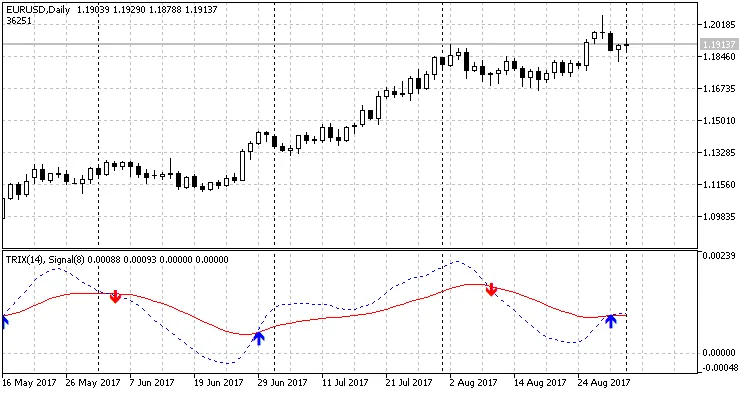
The MAMACD system utilizes two key iMA (Moving Average) indicators with periods of 85 and 75, calculated using the Low prices, while a third iMA with a period of 5 is based on Close prices.
A trade is triggered when the fast iMA (period 5) crosses above both slow iMAs. For an up trade, it's essential that the MACD is positioned above zero or is showing upward momentum.
Visually, having two MAs is crucial for effective trading. We set a modest take profit target of 15-20 points, which can vary based on currency volatility. Sure, some might argue that’s a small gain, but when you’re trading larger lot sizes across various pairs, those small wins can add up significantly. With a stop loss set at 10-15 points, you’ll find that it rarely gets hit.
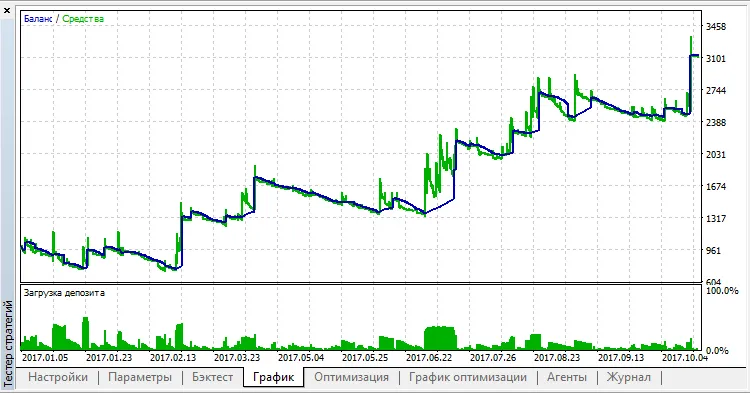
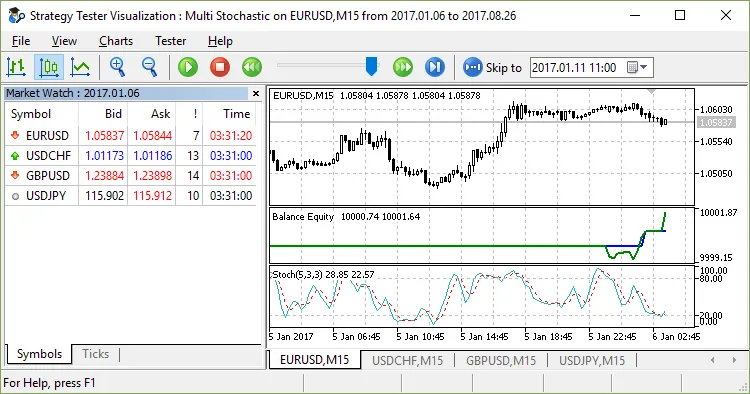
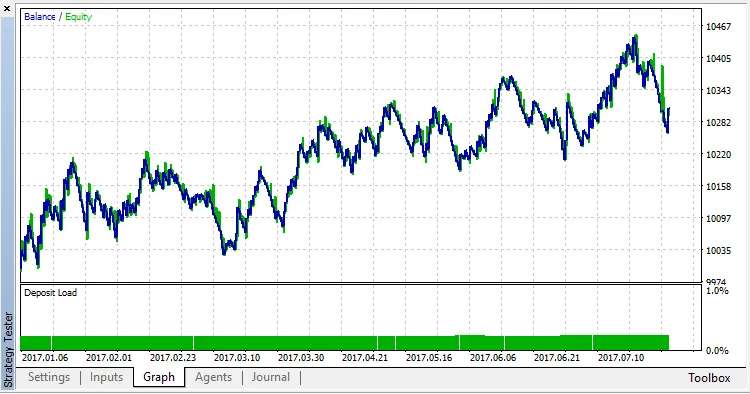
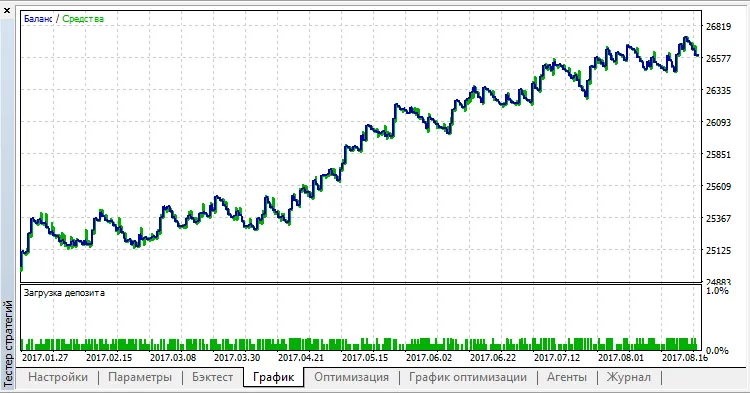
Let's take a look at the testing results over the past year (from 01 January 2017 to 31 October 2017) on the M15 timeframe:
Symbol
Pass
Result
Profit
Expected Payoff
Profit Factor
Recovery Factor
Sharpe Ratio
Custom
Equity DD %
Trades
USDJPY
3
3,247.67
247.67
0.48
1.07
1.25
0.04
0
6.60
521
EURJPY
14
2,610.75
-389.25
-0.69
0.90
-0.65
-0.05
0
19.56
563
EURGBP
11
2,566.31
-433.69
-0.86
0.92
-0.63
-0.04
0
22.42
506
EURUSD
0
2,482.42
-517.58
-0.93
0.89
-0.66
-0.06
0
25.07
557
AUDUSD
5
2,468.08
-531.92
-0.96
0.88
-0.66
-0.06
0
26.54
554
USDCAD
4
2,250.59
-749.41
-1.25
0.81
-0.98
-0.10
0
25.47
601
GBPUSD
1
2,001.58
-998.42
-1.70
0.80
-0.84
-0.11
0
38.63
586
EURCHF
13
1,985.18
-1,014.82
-2.22
0.76
-0.91
-0.12
0
37.14
458
EURCAD
16
1,791.18
-1,208.82
-2.12
0.71
-0.88
-0.15
0
45.92
569
USDCHF
2
1,790.78
-1,209.22
-2.13
0.76
-0.91
-0.13
0
43.78
568
EURAUD
12
1,678.28
-1,321.72
-2.22
0.70
-0.88
-0.16
0
49.82
596
AUDJPY
9
1,531.42
-1,468.58
-2.57
0.70
-0.99
-0.17
0
49.66
572
CHFJPY
10
1,493.13
-1,506.87
-2.29
0.73
-0.98
-0.15
0
51.05
658
AUDCHF
8
1,432.25
-1,567.75
-3.02
0.70
-0.94
-0.15
0
55.85
519
CADCHF
19
1,300.63
-1,699.37
-3.41
0.67
-0.94
-0.17
0
60.54
499
AUDCAD
7
1,142.15
-1,857.85
-3.32
0.60
-0.97
-0.22
0
63.60
560
GBPJPY
18
865.69
-2,134.31
-3.43
0.63
-1.00
-0.20
0
71.21
622
GBPCHF
17
122.78
-2,877.22
-5.22
0.55
-1.00
-0.17
0
95.91
551
EURNZD
15
100.52
-2,899.48
-6.50
0.39
-1.00
-0.27
0
96.65
446
AUDNZD
6
70.66
-2,929.34
-5.28
0.43
-1.00
-0.23
0
97.64
555
As you can see, the only currency pair that yielded a positive result was USDJPY.
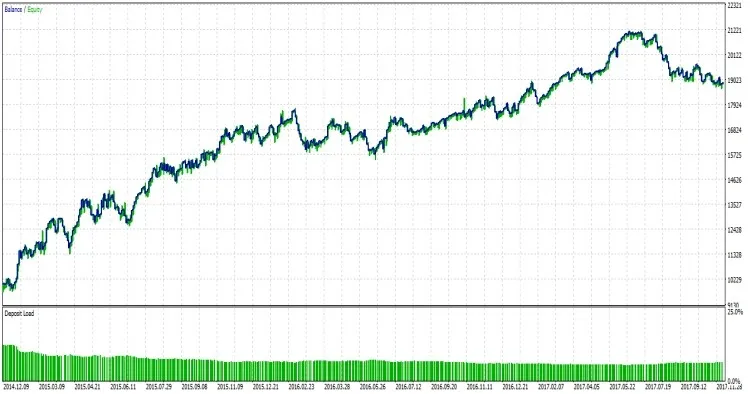
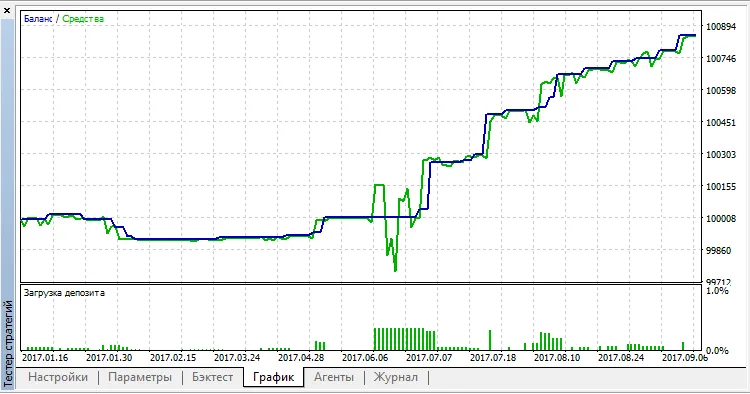
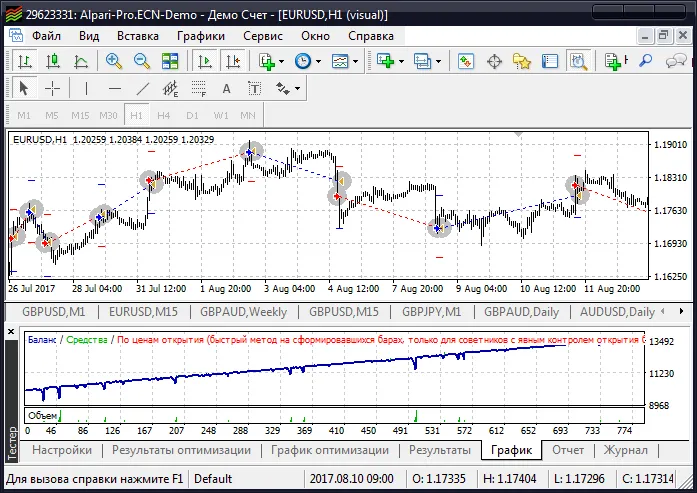
Now, let's review the performance results from the last year (from 01 January 2017 to 31 October 2017) on the H1 timeframe:
Symbol
Pass
Result
Profit
Expected Payoff
Profit Factor
Recovery Factor
Sharpe Ratio
Custom
Equity DD %
Trades
USDCAD
4
3,142.27
142.27
0.97
1.18
0.98
0.08
0
4.80
146
EURUSD
0
3,114.56
114.56
0.83
1.12
0.57
0.06
0
6.56
138
AUDJPY
9
3,024.26
24.26
0.17
1.02
0.17
0.01
0
4.55
139
AUDCHF
8
3,009.49
9.49
0.07
1.01
0.04
0.01
0
8.35
140
EURJPY
14
2,955.84
-44.16
-0.33
0.95
-0.21
-0.02
0
6.99
133
USDCHF
2
2,815.92
-184.08
-1.30
0.85
-0.64
-0.08
0
9.29
142
USDJPY
3
2,815.05
-184.95
-1.18
0.84
-0.61
-0.08
0
10.00
157
EURAUD
12
2,717.65
-282.35
-1.78
0.75
-0.64
-0.13
0
14.57
159
AUDUSD
5
2,669.29
-330.71
-2.09
0.76
-0.68
-0.13
0
16.25
158
EURCAD
16
2,627.66
-372.34
-2.47
0.67
-0.85
-0.20
0
14.45
151
GBPCHF
17
2,622.02
-377.98
-3.20
0.69
-0.75
-0.18
0
16.80
118
GBPUSD
1
2,620.28
-379.72
-2.47
0.73
-0.72
-0.15
0
17.17
154
EURGBP
11
2,566.81
-433.19
-3.09
0.73
-0.81
-0.15
0
17.65
140
AUDCAD
7
2,508.89
-491.11
-2.98
0.63
-0.89
-0.22
0
18.29
165
CADCHF
19
2,500.84
-499.16
-3.42
0.67
-0.84
-0.19
0
19.67
146
GBPJPY
18
2,360.00
-640.00
-4.74
0.52
-0.99
-0.32
0
21.51
135
AUDNZD
6
2,343.57
-656.43
-4.03
0.53
-0.92
-0.31
0
23.87
163
The takeaway? The MAMACD system shows promise, but results can vary widely by currency pair. Always do your due diligence and consider testing on a demo account before going live!
2018.01.22