Technical Indicator

Mastering the Double Smoothed Stochastic Indicator: A Trader's Guide
MetaTrader4
Mastering the Double Smoothed Stochastic Indicator: A Trader's Guide

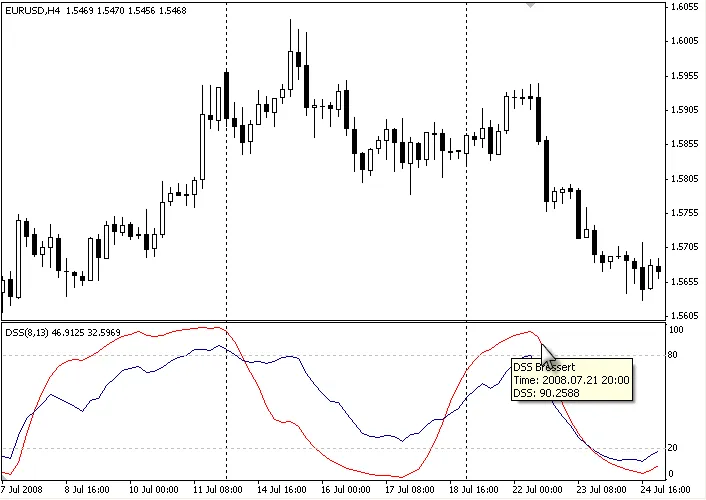
Hey there, fellow traders! Today, let’s dive into the Double Smoothed Stochastic Indicator (DSS), a powerful tool developed by Walter Bressert. If you’re familiar with the stochastic indicator, you’ll find that the DSS builds on that foundation with some added finesse. 
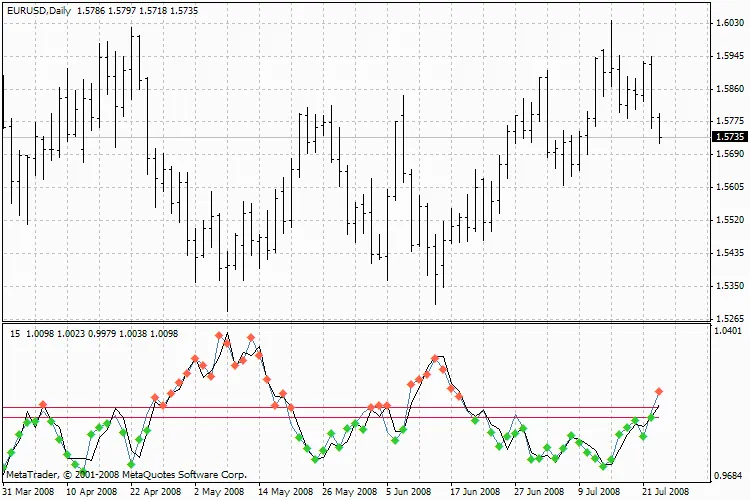
The DSS uses a calculation method quite similar to its stochastic counterpart. Here’s the gist: values above 80 indicate overbought conditions, while values below 20 signal oversold conditions. This dual-layer smoothing helps you pinpoint market movements more accurately. For those interested in the nitty-gritty, the formula is outlined on this site. Description William Blau and Walter Bressert each contributed their unique spins on the Double Smoothed Stochastics. This indicator employs two exponentially smoothed moving averages to smooth out the input values—highs, lows, and closes—similar to how the traditional stochastic formula operates. Calculation Here’s how you can calculate the DSS: 1. **Numerator:** Start by calculating the difference between the current close and the period low. **Denominator:** This is the difference between the period high and the period low. Now, take the quotient of the numerator and denominator, apply exponential smoothing, and multiply by 100. 2. The second step follows a similar method, using the newly calculated price series from the first step. Parameters You can adjust the period length anywhere from 2 to 500. Most traders typically use a period length between 5 and 30. Additionally, the smoothing interval can range from 1 to 50, with shorter smoothing values being more meaningful for short-term analysis.
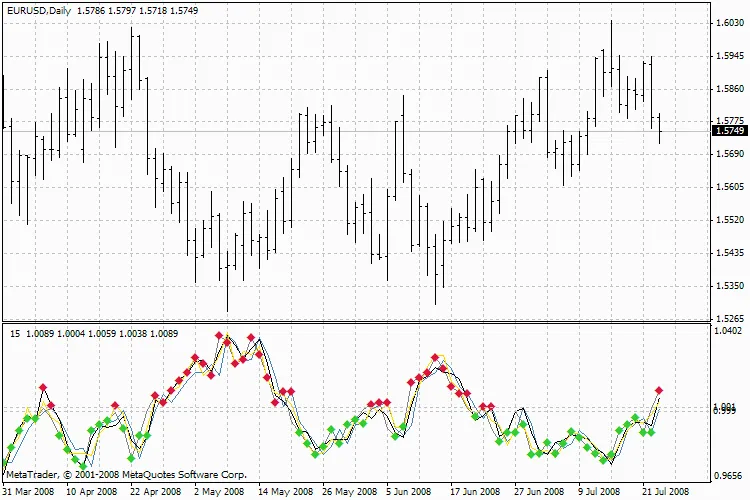
 Interpretation Using the DSS is much like using the traditional stochastic method. Values above 70 or 80 are generally considered overbought, while values below 20 or 30 indicate oversold conditions. If you see the DSS rising above its center line, that’s a bullish signal; conversely, a drop below the center line suggests a bearish trend.

2008.08.13
Mastering Support and Resistance with Waddah Attar's Super Indicator
MetaTrader4
Mastering Support and Resistance with Waddah Attar's Super Indicator

Are you ready to elevate your trading game? The Waddah Attar Super Indicator is here to help you identify over 160 different support and resistance levels with ease. This powerful tool classifies these levels using a simple color gradient of red and green, making it visually appealing and highly functional. Let’s break it down: Strong Levels: The indicator highlights 63 strong levels on daily, weekly, and monthly charts. Hidden Levels: It identifies 21 hidden levels across the same timeframes. RSI Saturation Levels: With 11 RSI levels displayed, you can easily gauge market strength. Pivot Levels: The indicator shows 33 pivot levels, complete with support and resistance for each one. Camarilla Levels: You’ll also find 24 camarilla levels with their respective support and resistance. High and Low Levels: Finally, it tracks 9 levels for daily, weekly, and monthly highs and lows. The beauty of this indicator is its flexibility. You can easily control which sets of levels to display or hide, allowing you to customize your trading view. Additionally, you can adjust the thickness of the lines representing these levels to better differentiate their strengths. Want to know how to visualize these levels? The indicator allows you to see whether a price level is acting as support or resistance based on whether it's been broken. And with the AutoSupRes feature, you can dictate how you want these levels to appear based on current market dynamics. Lastly, if you want to focus on the stronger combined levels, you can easily adjust the settings to hide the weaker ones. This way, you can keep your chart clean and your focus sharp. With the Waddah Attar Super Indicator at your disposal, navigating the markets has never been easier. Happy trading!

2008.08.10
How to Use the Magnified Market Price Indicator for Trading
MetaTrader4
How to Use the Magnified Market Price Indicator for Trading

Hey fellow traders! Today, I want to share a nifty little tool that can really sharpen your trading game—the Magnified Market Price indicator. This tool is super straightforward and can make a significant difference in how you visualize price movements on your charts. Getting to Know the Magnified Market Price Indicator The Magnified Market Price indicator is designed to display the current price on your trading chart in a clear and easy-to-read format. Here’s how you can customize it to suit your trading style: Indicator Parameters Auto Color Change: Do you want the font colors to change automatically? Set this to True for yes. Bid/Ask Colors: Choose whether to display bid and ask prices in different colors (set this to True). Default Font Color: You can set this to your preferred color—let’s say Black for a classic look. Font Size: Adjust the font size; a good starting point is 24. Font Type: Comic Sans MS is a fun choice, but feel free to use whatever you like! Price Display Location: Decide where you want the price to show on your chart. Options include: Upper Left = 0 Upper Right = 1 Lower Left = 2 Lower Right = 3 Magnified Market Price Indicator So, if you’re looking to make your charts more user-friendly and visually appealing, give the Magnified Market Price indicator a spin. Whether you’re a newbie or a seasoned pro, this tool can help you keep your eyes on the prize—literally!

2008.08.07
Mastering the CCI_onMA Indicator for Strategic Trading
MetaTrader4
Mastering the CCI_onMA Indicator for Strategic Trading

Hey there, fellow traders! Today, we're diving into the CCI_onMA indicator, a versatile tool that can help sharpen your trading strategies. Indicator Overview The CCI_onMA combines the Commodity Channel Index (CCI) with a moving average, making it a handy resource for identifying market trends. Whether you're a day trader or a swing trader, understanding this indicator can give you an edge. Parameters You Need to Know Here are the key parameters you’ll be working with: CCI_Period: 14 CCI_Price: 5 CCI_multiplier: 0.3 MaPeriod: 14 MaMethod: 0 (you can choose between SMA, EMA, SMMA, or LWMA) MaPrice: 5 These parameters can help you customize the CCI_onMA indicator to better fit your trading style. Understanding the Inputs Here's a breakdown of what each parameter does: CCI_Period: This defines the number of periods for the CCI calculation. A lower number means more sensitivity to price changes. CCI_Price: This sets the price type used in the CCI calculation. You can tweak this for different market conditions. CCI_multiplier: This adjusts the CCI value, allowing you to control its strength. MaPeriod: This is the period for the moving average, which helps smooth out price data. MaMethod: Choose the type of moving average that works best for you. Each has its own characteristics. MaPrice: Similar to CCI_Price, this indicates the price type for the moving average. CCI_onMA Indicator Understanding how to set up and utilize the CCI_onMA can really enhance your trading strategy. Remember, practice makes perfect! Test it out on a demo account before going live, and see how it fits into your trading approach.

2008.08.05
First Previous 359 360 361 362 363 364 365 366 367 368 369 Next Last