MetaTrader4
Mastering Candlestick Combinations: A Trader's Guide
If you're serious about trading, understanding candlestick patterns is a game changer. Today, we're diving into the world of candlestick combinations, inspired by Steve Nison's book, "Japanese Candlesticks." Let’s break down some key patterns that can help you make informed trading decisions.
Candlestick Combinations You Need to Know
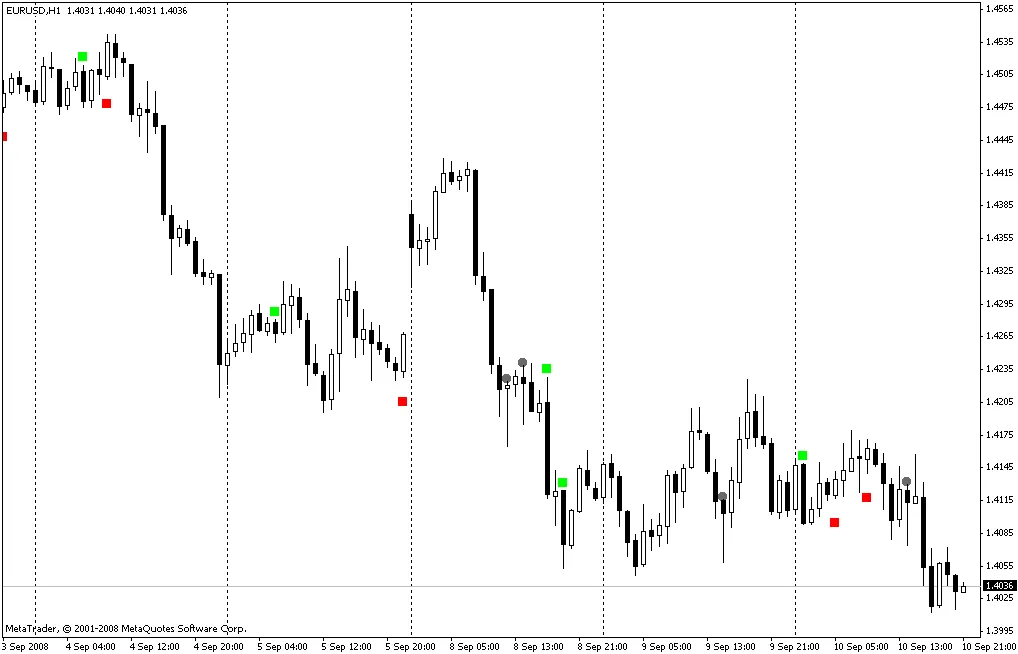
Here are some essential candlestick patterns and their indicators:
Hammer / Hanging Man: Symbol code 108, color: DimGray. This pattern can indicate potential reversals.
Bullish Engulfing: Symbol code 110, color: Red. This indicates a bullish trend and signals buying opportunities.
Bearish Engulfing: Symbol code 110, color: Lime. This pattern suggests a bearish trend, signaling potential selling points.
Dark Cloud Cover: Symbol code 116, color: Lime. Another bearish indicator that traders should watch closely.
Cloud Gap: Symbol code 116, color: Red. This can signify a bullish trend, so keep an eye out for it.
Doji: Symbol code 174, color: Indigo. The Doji is often used with other patterns to confirm potential reversals.
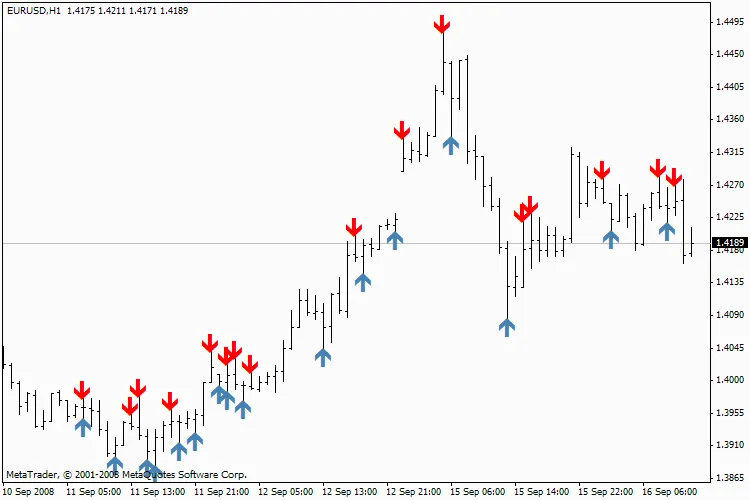
For quick reference, simply hover over a symbol, and a pop-up window will appear, providing you with the name and description of the candlestick combination.
Important! Always wait for strong signals to confirm your trades when using candlestick combinations.
For instance, if you spot a Hanging Man after a significant uptrend, watch the open price of the next candlestick. It should break the closing price of the Hanging Man to confirm the potential reversal.
Understanding these patterns can significantly enhance your trading strategy. So, keep practicing and watch for those combinations!
2008.10.12