Technical Indicator

Unlocking the Power of the Extrapolator Indicator for Predictive Trading
MetaTrader4
Unlocking the Power of the Extrapolator Indicator for Predictive Trading

Hey fellow traders! Today, let’s dive into a fascinating tool that can help you predict future price movements: the Extrapolator Indicator. This nifty tool uses a variety of methods to generate its predictions, and you can choose the one that suits your trading style best. Let’s break it down! Methods of Prediction Method 1: Fourier's Extrapolation - This method calculates frequencies using the Quinn-Fernandes Algorithm. Method 2: Autocorrelation Method. Method 3: Weighted Burg Method. Method 4: Burg Method with Helme-Nikias weighting function. Method 5: Itakura-Saito (geometric) method. Method 6: Modified Covariance Method. Methods 2 through 6 utilize linear prediction techniques, which means they forecast future prices based on past price data. For instance, if we have a series of prices labeled as x[0] to x[n-1] (where the highest index represents the most recent price), the future price x[n] can be calculated with the formula: x[n] = -Sum(a[i]*x[n-i], i=1..p) In this formula, a[i=1..p] represents the model coefficients and p is the order of the model. The methods from 2 to 6 optimize these coefficients by minimizing the mean-root-square error over the last n-p bars of data. While we could theoretically achieve zero prediction error using the Levinson-Durbin method, it’s often unstable, which is why it’s not included here. Input Parameters LastBar: Refers to the number of the last bar in the historical data. PastBars: This is the number of past bars utilized for forecasting future values. LPOrder: This indicates the order of the linear model as a fraction of the number of past bars (0 to 1). FutBars: The number of future bars for which predictions are made. HarmNo: The maximum number of frequencies for Method 1 (set to 0 to use all frequencies). FreqTOL: The acceptable imprecision in frequency calculations for Method 1 (values >0.001 may lead to convergence issues). BurgWin: This determines the weighting function for Method 2 (0 for Rectangular, 1 for Hamming, and 2 for Parabolic). When you use the Extrapolator, it visually represents its predictions with two lines: the blue line tracks the modeled prices over the training bars, while the red line shows the predicted future prices. Below are some examples of the methods in action: Visual Examples Method 1 (Fourier Series Extrapolation) Method 3 (Burg's Method) Method 6 (Modified Covariance Method) Call for Collaboration If you successfully develop a profitable trading system based on this indicator, I’d love to hear your thoughts! Please share your insights via the email provided in the code.

2008.12.25
Mastering Candle Patterns: A Trader's Guide to Chart Analysis
MetaTrader4
Mastering Candle Patterns: A Trader's Guide to Chart Analysis

Hey fellow traders! Today, we're diving into the fascinating world of candle patterns. I want to give a shout-out to the brilliant minds behind the code that has helped shape this discussion. Special thanks to the resource Japanese Candlesticks by Candlestick.com, which outlines various bullish and bearish scenarios, and to CandleCode by Victor Likhovidov. These references are invaluable for anyone looking to sharpen their trading skills! Setting Up Candle Patterns To get started, you’ll want to place the necessary files in the following directories: Candle Patterns.mq4 into "\experts\indicators" Candle Patterns.csv into "\experts\files" Candle Patterns.rtd into "\experts\files" Symbols_.csv into "\experts\files" gSpeak.mqh into "\experts\include" speak.dll into "\experts\libraries" candle patterns.tpl into "\templates" After placing the files, make sure to close and restart MetaTrader so it can recognize the new additions. Then, navigate to "Indicators" -> "Custom" -> "Candle Patterns" to get started. In the "Custom Indicator" window, head over to the "Common" tab and enable "Allow DLL imports". Understanding Inputs The details for the "Inputs" can be found in the file "Candle Patterns.rtd". Alternatively, you can simply right-click on your chart and select the "candle patterns.tpl" template for a quick setup. Now, a little personal note: I spent my youth in Kinshasa, and if you find these tools helpful in your trading journey, I encourage you to give back. Consider donating to support the people of the Democratic Republic of the Congo through this charity or any organization you believe in. Take care and happy trading!Teddy

2008.12.16
Unlocking Forex Success: The WKBIBS Indicator Explained
MetaTrader4
Unlocking Forex Success: The WKBIBS Indicator Explained

The WKBIBS indicator is a cutting-edge oscillator that combines the strengths of two popular indicators: WKB and IBS. Whether you're a newbie in Forex or a seasoned pro, this tool can enhance your trading strategy. What sets WKBIBS apart? It provides early signals compared to traditional oscillators like stochastic, and unlike many arrow indicators, it doesn’t paint a false picture or redraw signals. Take, for example, Trend_Signal_2008—these arrow indicators might look appealing on a static chart, but they often lag behind in real-time trading, leaving you with outdated signals when you need them most. The WKBIBS, however, is straightforward and offers timely, reliable signals. How to Trade with WKBIBS: Trading with WKBIBS is a breeze. When the red line crosses below the blue line, it’s time to SELL. Conversely, when the red line crosses above the blue line, it’s a signal to BUY. The clarity of these signals on your chart ensures that you’re acting on relevant price movements, unlike with arrow indicators where you might miss the boat. You also have the flexibility to incorporate other strategies, such as utilizing a trend filter to guide your trades. The choice is yours! WKBIBS works seamlessly with the IBS indicator. Input Parameters: extern int       RangePeriod=25; extern int       SmoothPeriod=3; extern int       SmoothMode=MODE_SMA; extern int       Per=5; VKWBIBS

2008.12.10
Understanding Madlen 5.0: Your New Trading Ally
MetaTrader4
Understanding Madlen 5.0: Your New Trading Ally

Hey there, fellow traders! Let’s dive into the world of the Madlen 5.0 indicator, which is a fantastic tool for identifying support and resistance levels in your trading strategy. The Madlen lines are much like your classic support and resistance lines. The beauty of these lines is that they avoid those pesky false breakouts; you might even call them the "true trend lines." They come into play when you draw them based on specific trading signals. Here’s how it works: when you draw a line that slopes up at a 45-degree angle, you're looking at a support line. Conversely, if the line slopes down at a 315-degree angle, that's your resistance line. Simple, right? Remember, the more traders focus on a particular support or resistance line, the more likely it is that those lines will flip roles in the future. For example, a support line can become a resistance line and vice versa. A solid signal to watch for is when the body of a candlestick closes beyond the line or when a new candlestick opens outside that area. This is when the price starts to form parallel trend channels. But that’s not all! Different types of triangles can also form within these channels. Pay special attention to the midpoint of the triangle, especially as it nears completion. The price action within the triangle often builds momentum, leading to a breakout beyond its limits. The triangles are drawn using various colored lines, while the channels typically use a single color. To get a deeper understanding, check out the link below: Read more... Input Parameters: string str="Madlen v5"; extern string __="Signal delivery"; extern bool cfg_Signal=false; extern string _="Parameters of drawing"; extern int cfg_Period=0; //D1 extern int cfg_MaxBars=5; //number of candlesticks to be drawn extern bool cfg_Ray=true; //drawing by rays or not extern bool cfg_DrawLast=true; //drawing of next to the last candlestick. extern bool cfg_DrawFibo=true; //drawing of Fibo extern string _Session="Settings of sessions drawing"; extern bool cfg_DrawSession=true; extern color cfg_SessionColor1=MediumTurquoise; //European extern color cfg_SessionColor2=Gainsboro; //American extern string _Risks="Risks"; double cfg_RiskLots=0.1; extern  double cfg_Risk=0.01; extern  int    cfg_RiskLevelPoint=25; Madlen 5.0

2008.12.09
Mastering NonLagAMA: Your Guide to Enhanced Trading Decisions
MetaTrader4
Mastering NonLagAMA: Your Guide to Enhanced Trading Decisions

What is NonLagAMA? The NonLagAMA (Non-Lagging Adaptive Moving Average) is a powerful tool for traders who want to stay ahead of the game. Unlike traditional moving averages, this indicator helps smooth out price fluctuations while reducing lag, allowing you to make quicker and more informed trading decisions. Why Use NonLagAMA? 
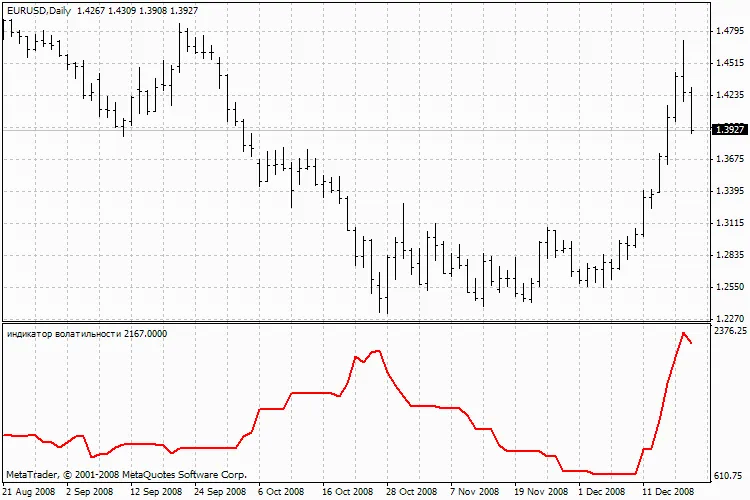
Reduced Lag: As the name suggests, NonLagAMA minimizes the delay often seen with standard moving averages. Adaptive Nature: It adapts to market conditions, making it suitable for various trading styles. 
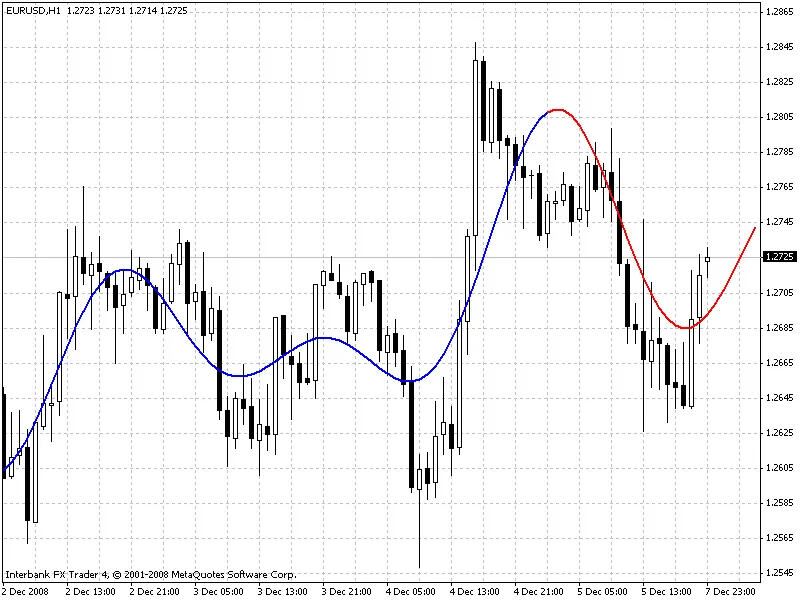
Clear Signals: The indicator provides clearer buy and sell signals, helping you spot trends more effectively. Setting Up NonLagAMA To get started with NonLagAMA, here’s a simple walkthrough: Download the Indicator: You can find the NonLagAMA.mq4 file online. Make sure to use a trusted source. Install the Indicator: Place the downloaded file in your MetaTrader 4 (MT4) indicators folder. Configure Settings: Open the indicator settings and adjust parameters like Price, Length, Displace, and Filter according to your trading strategy. Understanding the Code Here’s a brief overview of the key components of the NonLagAMA code: #property indicator_chart_window #property indicator_buffers 3 #property indicator_color1 Yellow #property indicator_color2 RoyalBlue #property indicator_color3 Red 
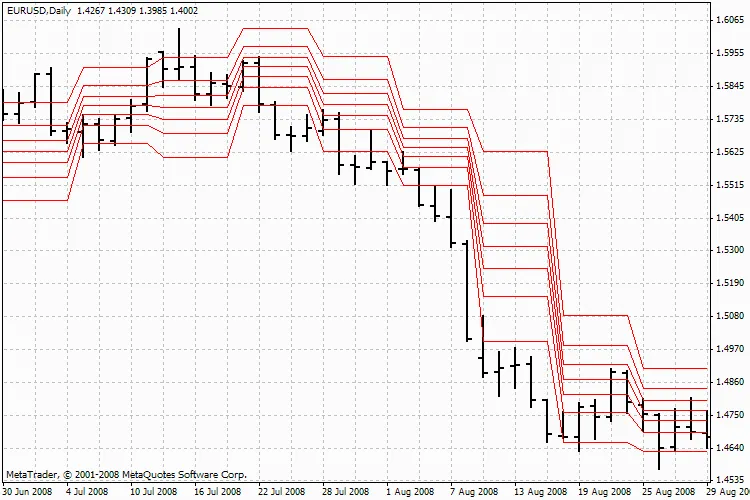
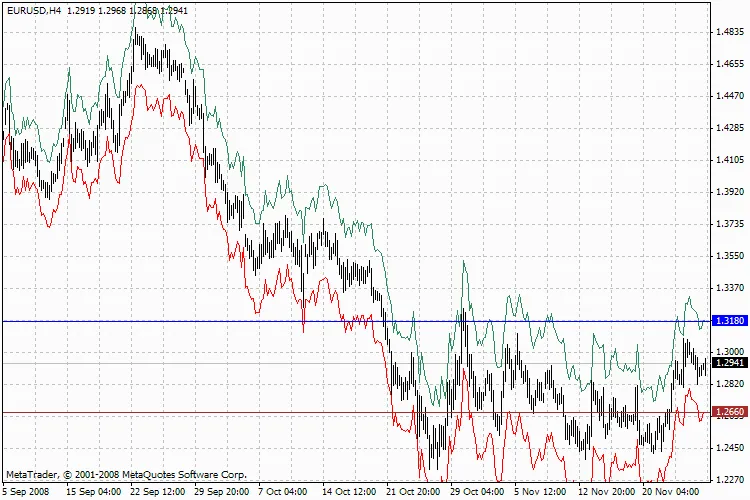
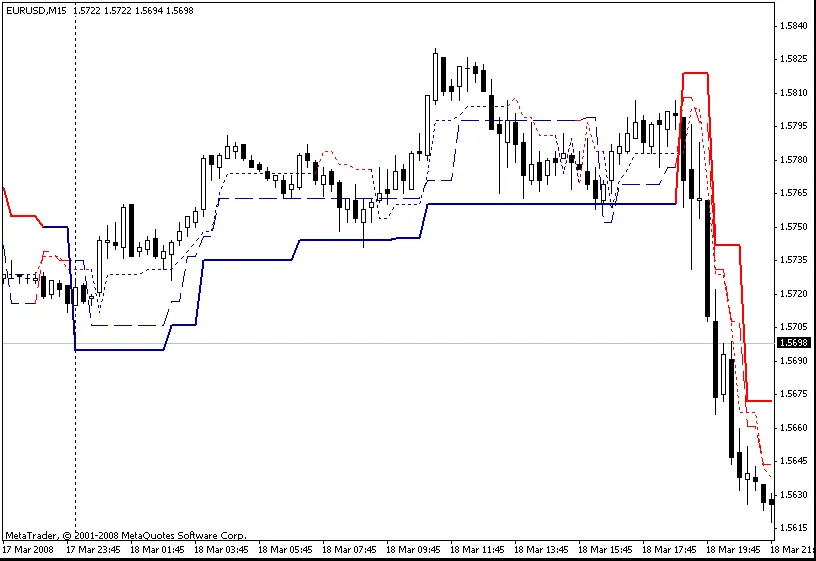
The indicator is designed to work on the chart window and utilizes three buffers to display the moving average, upper, and lower bands. You can customize the colors and widths of these lines to suit your preferences. Using NonLagAMA in Your Trading Strategy Once you have the NonLagAMA set up, integrate it into your trading strategy: 
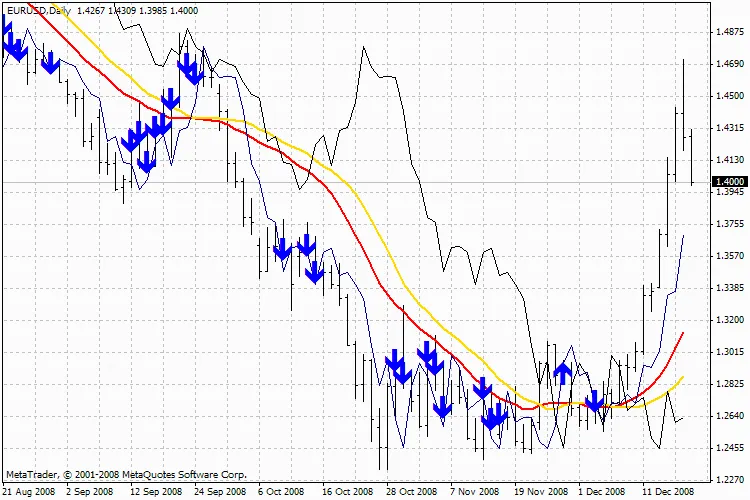
Identify Trends: Use the indicator to spot upward and downward trends in the market. Confirm Signals: Look for convergence with other indicators to confirm buy or sell signals. Set Alerts: Configure alerts for when the price crosses key levels, so you never miss a trading opportunity. Final Thoughts The NonLagAMA is a fantastic addition to any trader's toolbox. By minimizing lag, it helps you stay on top of market movements. Remember, while it's a powerful tool, always combine it with a solid risk management strategy and other indicators for the best results.

2008.12.05
First Previous 351 352 353 354 355 356 357 358 359 360 361 Next Last