Welcome, fellow traders! Today, we're diving into the world of the Keltner Channel, a powerful indic...
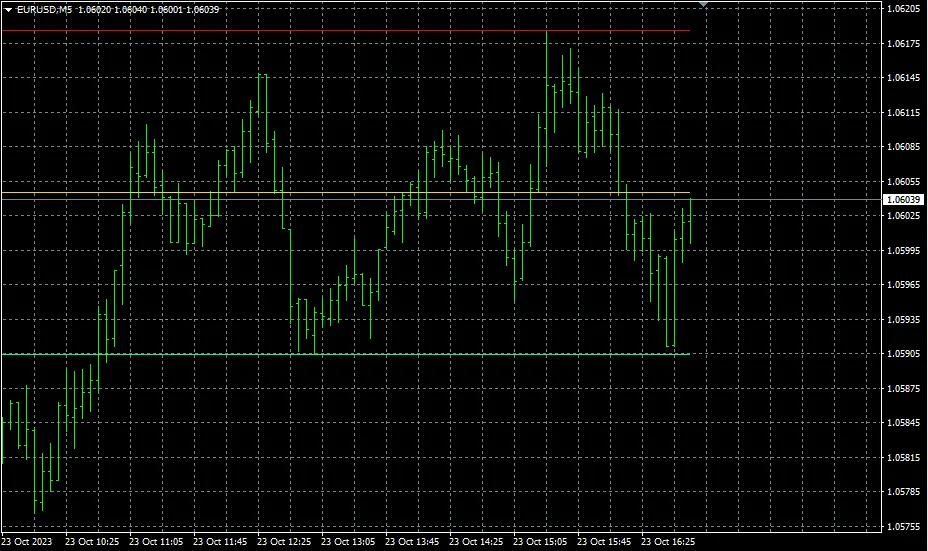
Hey there, fellow traders! If you’re diving into the world of support and resistance, you’re in for ...
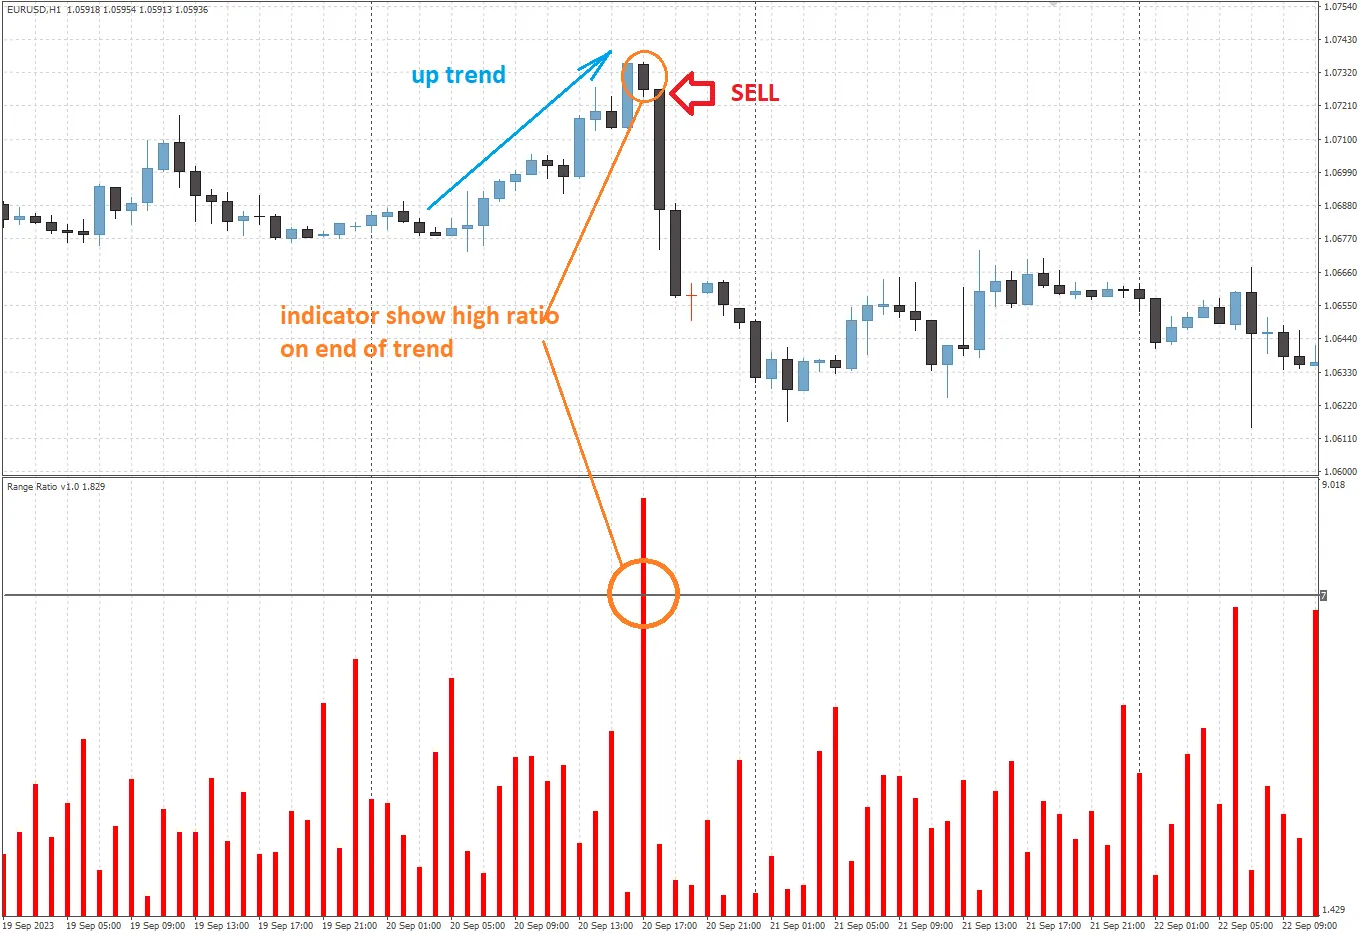
If you're looking to elevate your chart analysis game, the Range Ratio indicator for MetaTrader 4 is...
If you're looking to level up your trading game, the MT5 CCI with a shift parameter is a fantastic t...
Hey fellow traders! If you’re looking to sharpen your trading edge, let me introduce you to the M4H...
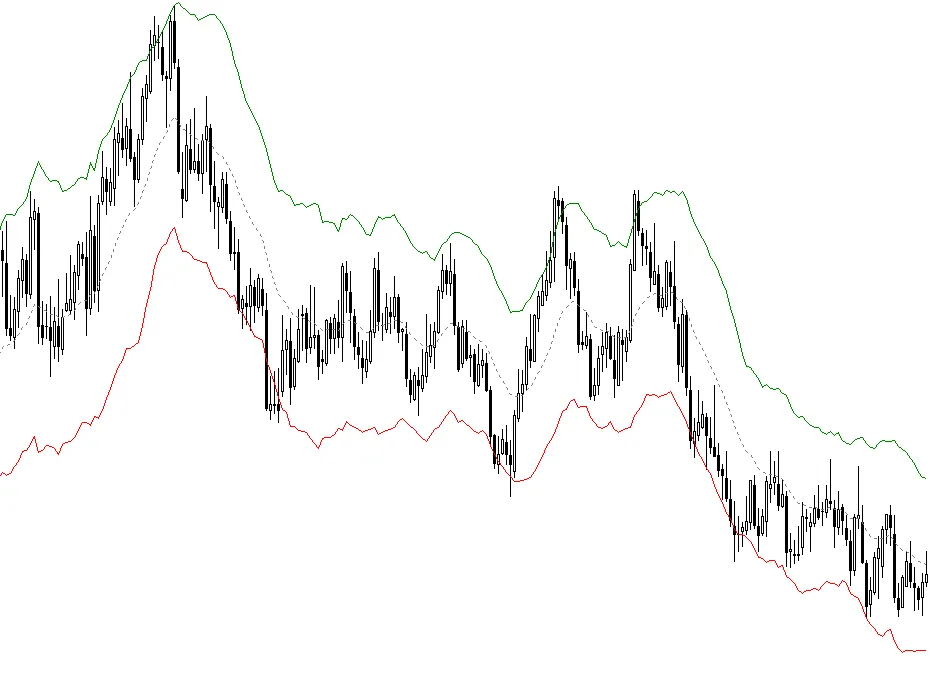
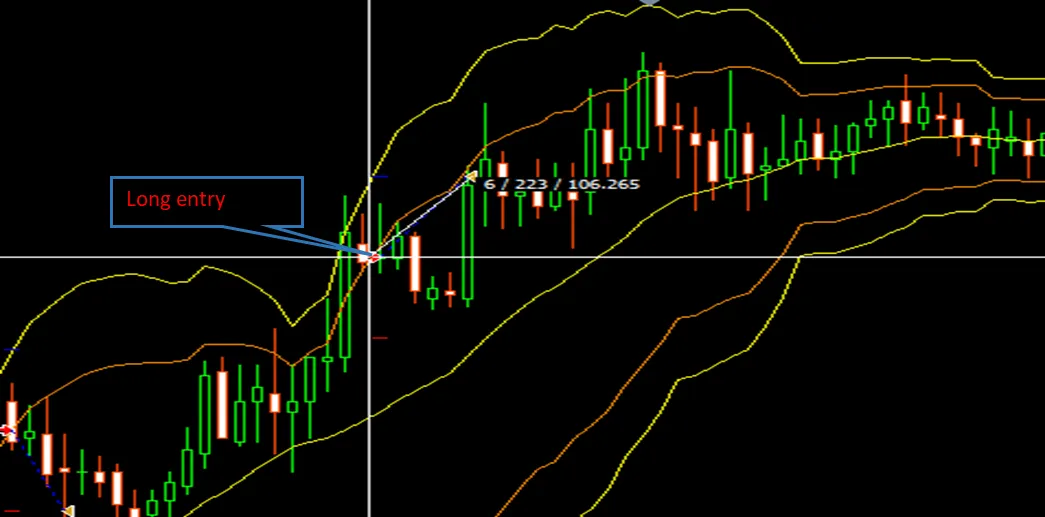
1. Overview The Double Bollinger Band Strategy utilizes two Bollinger Bands to help traders filter t...
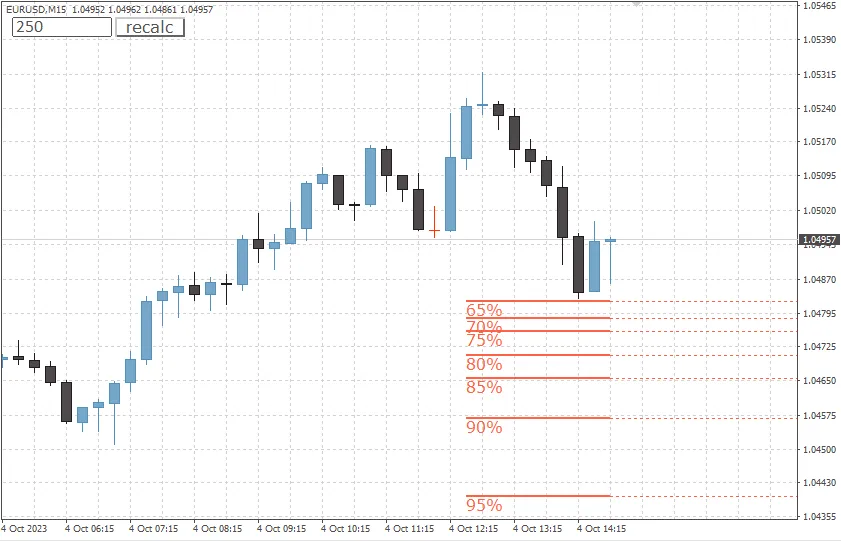
If you're looking to fine-tune your trading strategy, the Price Rebound Calculator is a must-have to...
Hey traders! Today, I’m excited to share a neat little tweak on the Mod_ATR_Trailing_Stop indicator ...
If you’re looking to sharpen your trading edge, the Trend Predictor is a game-changing indicator wor...
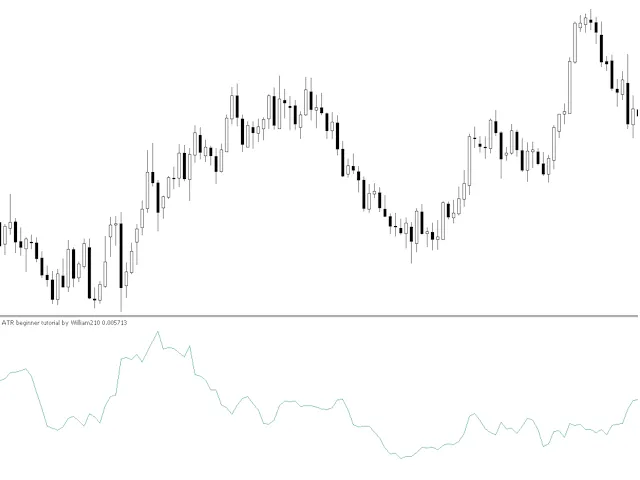
Hey fellow traders! If you’re just starting out in the world of trading, you might have come across ...
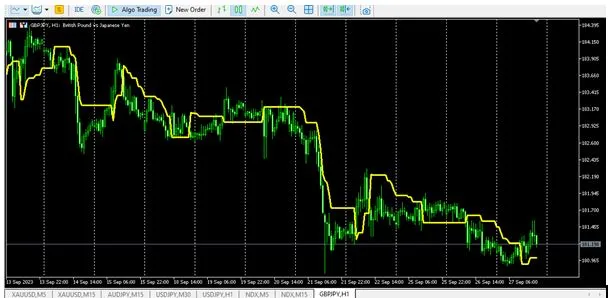
Hey there, fellow traders! If you’re diving into the world of trading, you’ve probably heard about t...
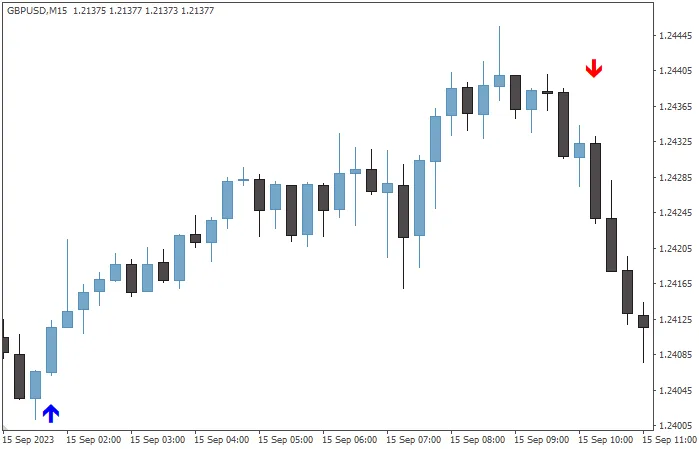
If you're navigating the world of trading, you've likely come across the Marubozu candlestick. This ...
Welcome to the World of Adaptive Moving Averages! If you're diving into the trading scene, understan...
Welcome, fellow traders! Today, we're diving into the Alligator Indicator, a fantastic tool for thos...
Hey fellow traders! If you're diving into the world of technical analysis, understanding how to use ...
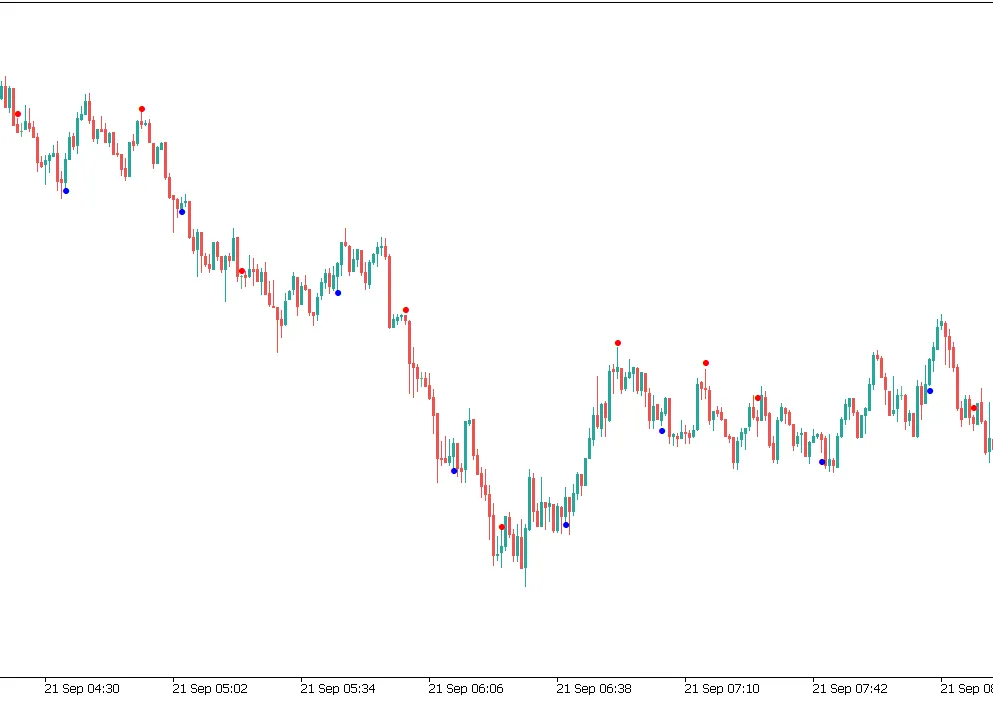
If you’re diving into the world of trading, you’ve probably heard about fractals. They’re one of the...
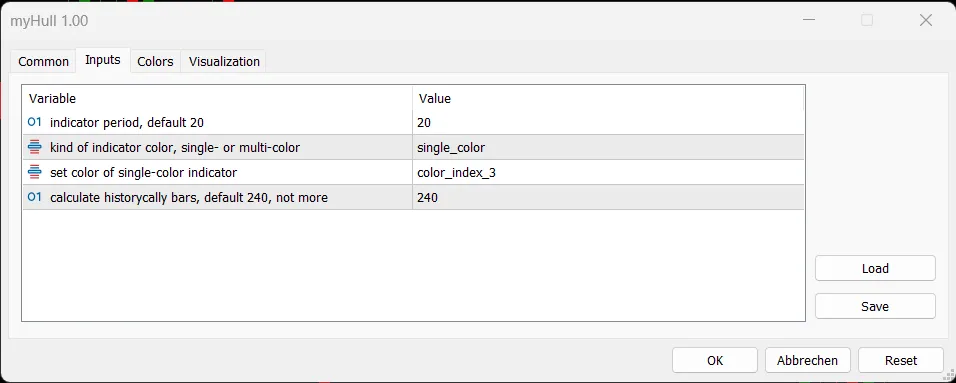
Hey fellow traders! Today, I'm diving into a nifty tool that can enhance your trading game—the Hull ...
Hey there, fellow traders! Today, let's dive into a fascinating tool that can enhance your trading s...
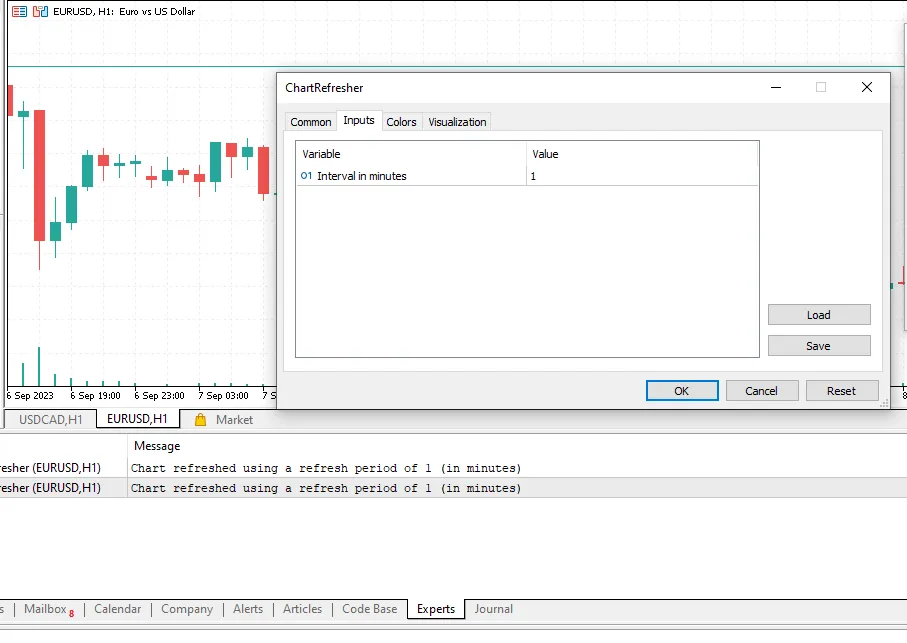
As traders, we know how frustrating it can be when our indicators misbehave. Sometimes, you might no...
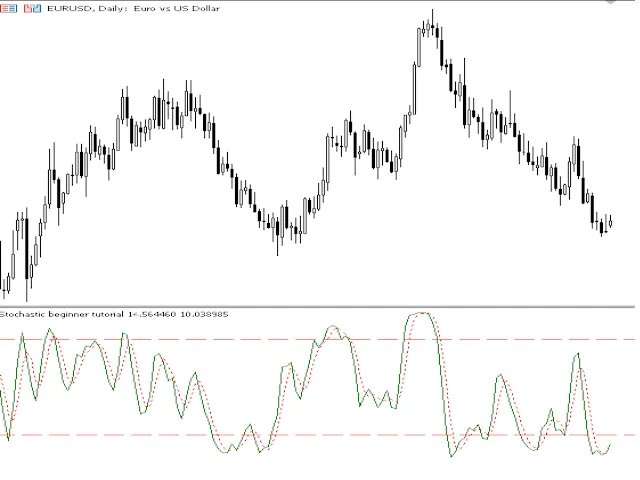
Welcome to the World of Stochastic Indicators! Hey there, fellow traders! If you're just getting you...