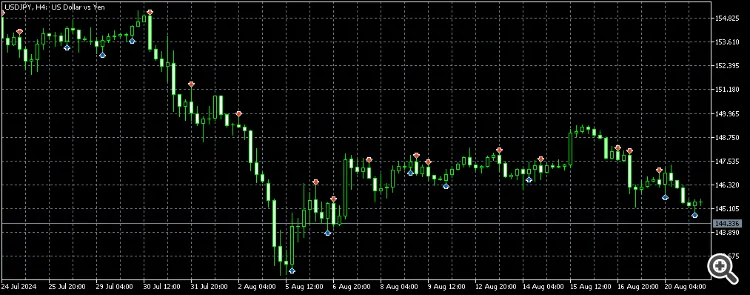
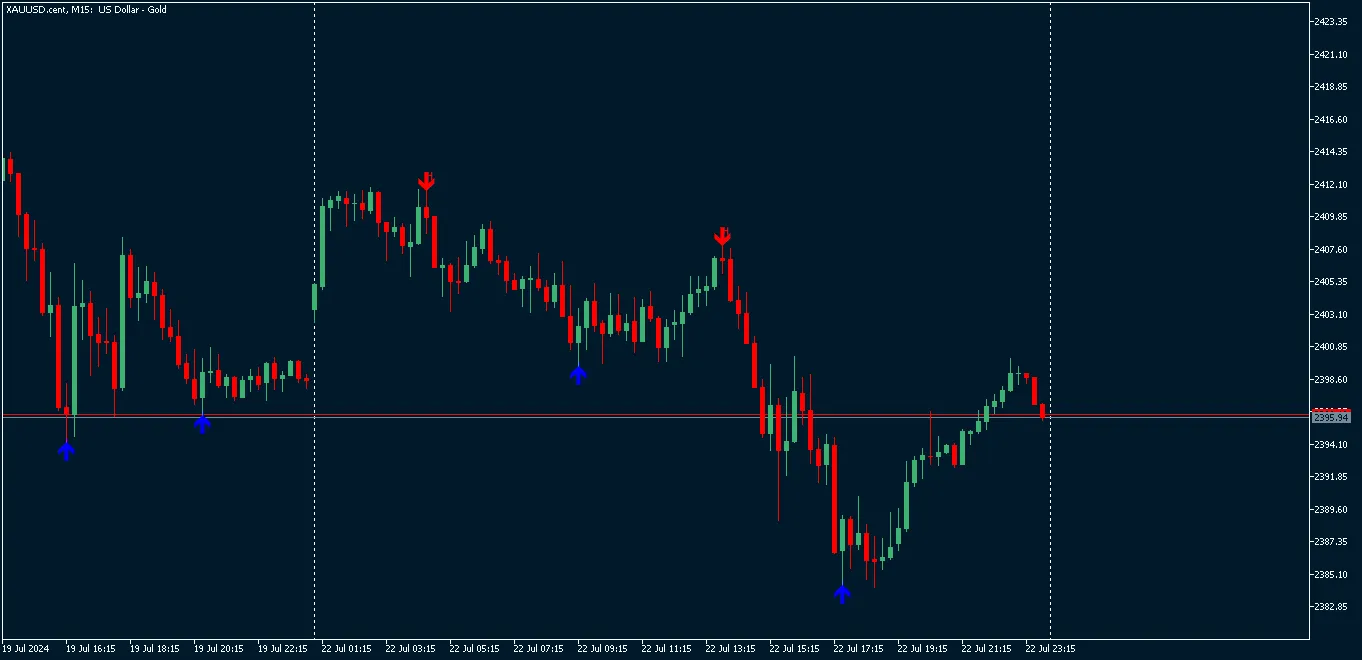
Hey traders! If you're on the lookout for a reliable way to spot potential buying opportunities, you...
Understanding the RSI Engulfing Bar V2 Indicator If you're looking to boost your trading game, the R...
If you're diving into trading, understanding candle patterns is crucial, and the Engulfing Indicator...
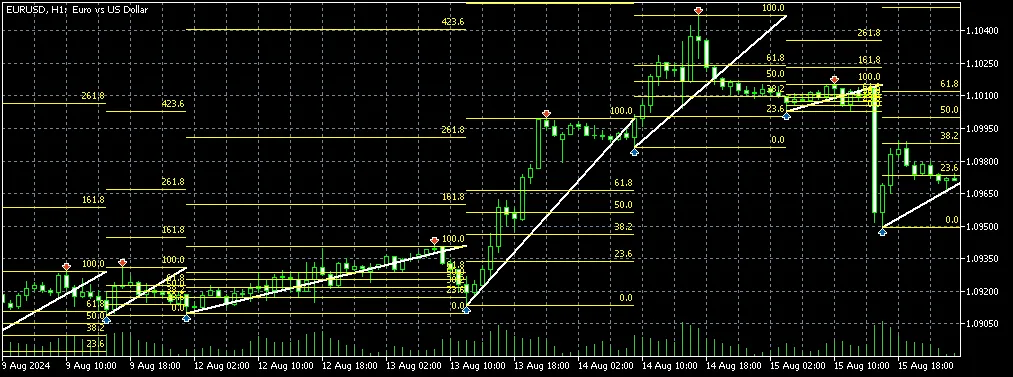
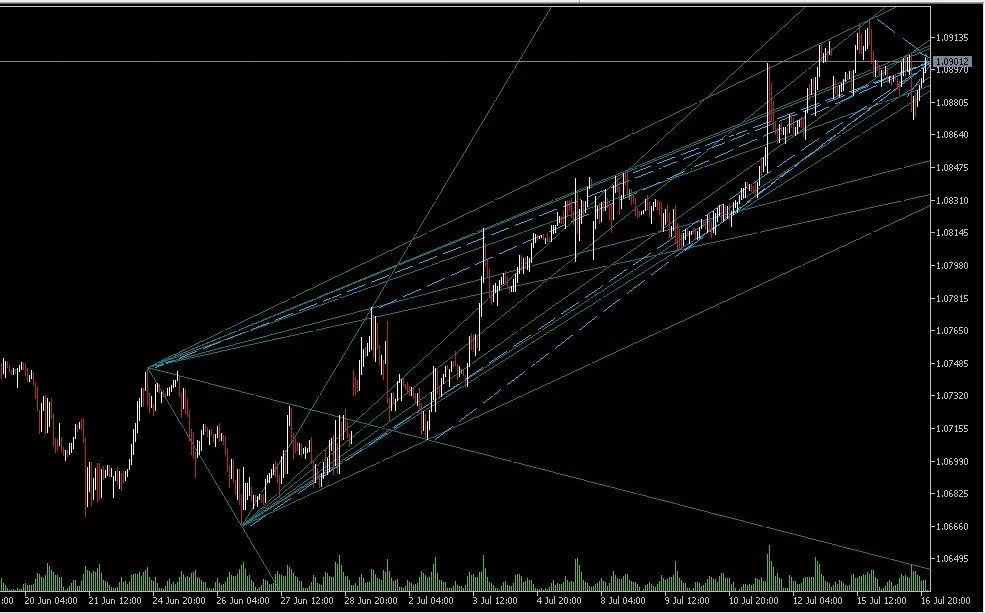
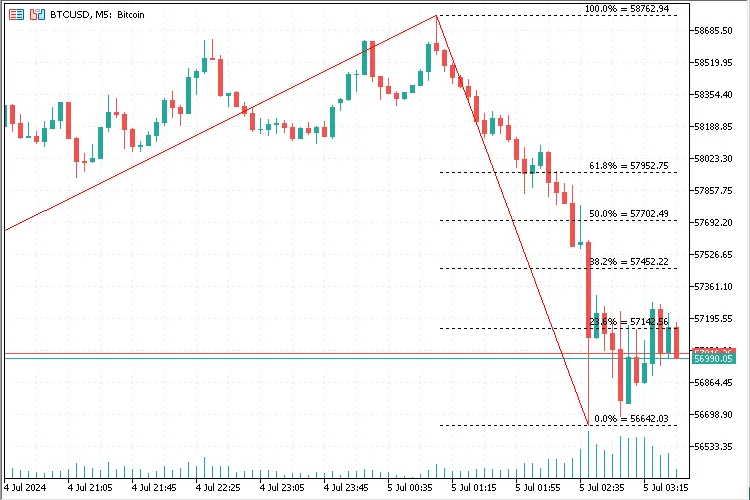
Hey fellow traders! Today, I want to share some insights on the Swing High Low and Fibonacci Retrace...
What is a Fair Value Gap (FVG)? In the trading world, a Fair Value Gap (FVG) represents a price inef...
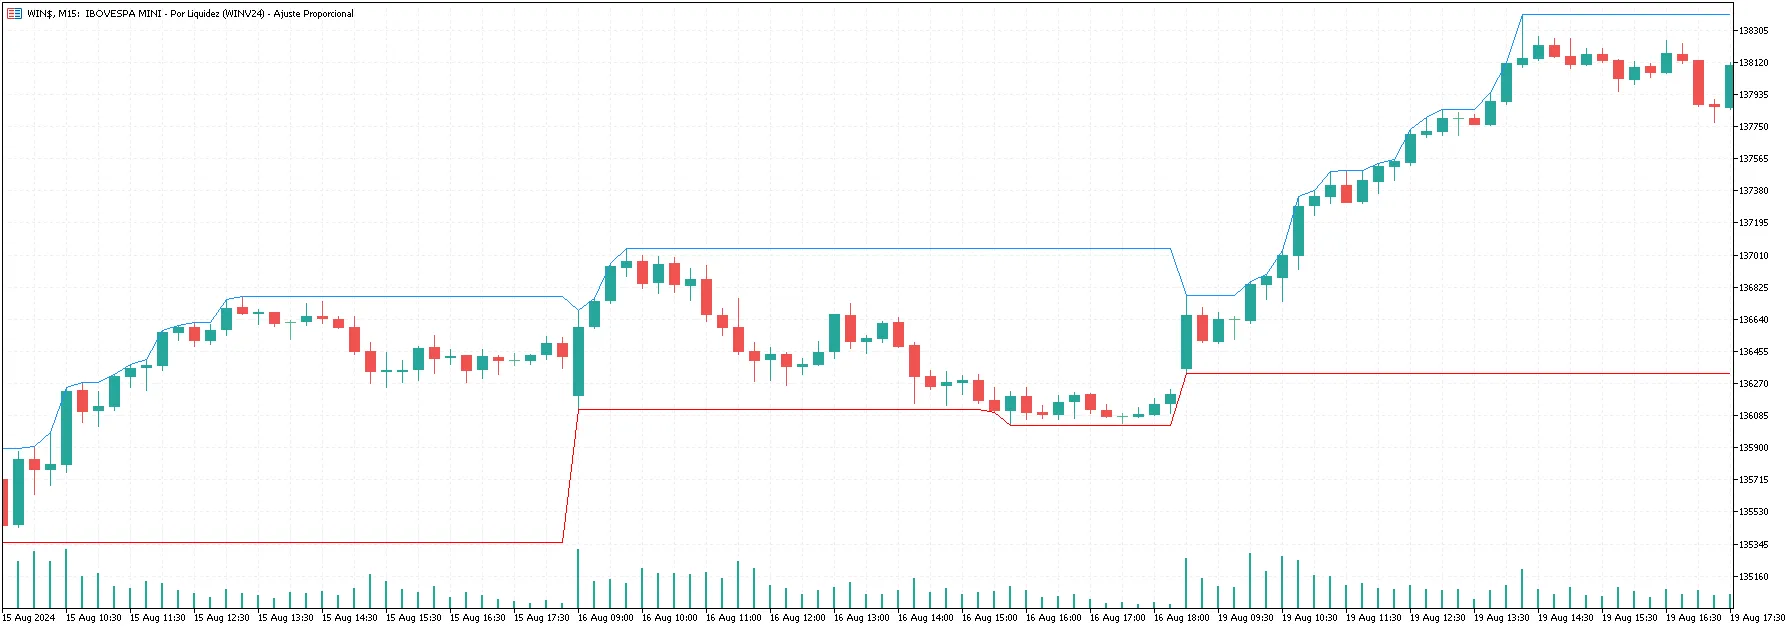
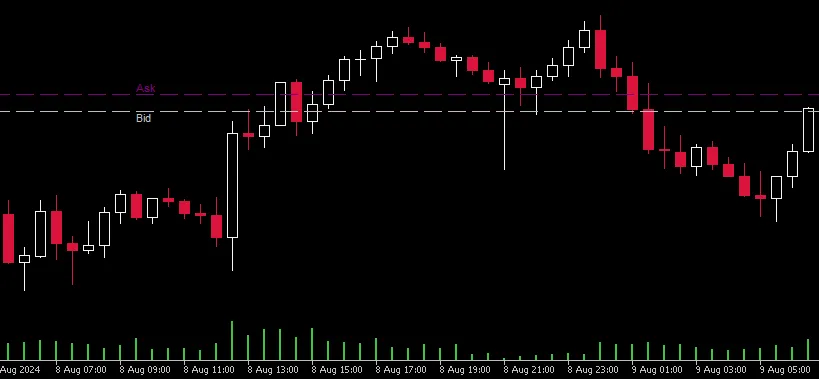
The High and Low Line Indicator is a simple yet effective tool that helps you plot the highest and ...
If you're looking to sharpen your trading game, this custom indicator for MetaTrader 5 is a game-cha...
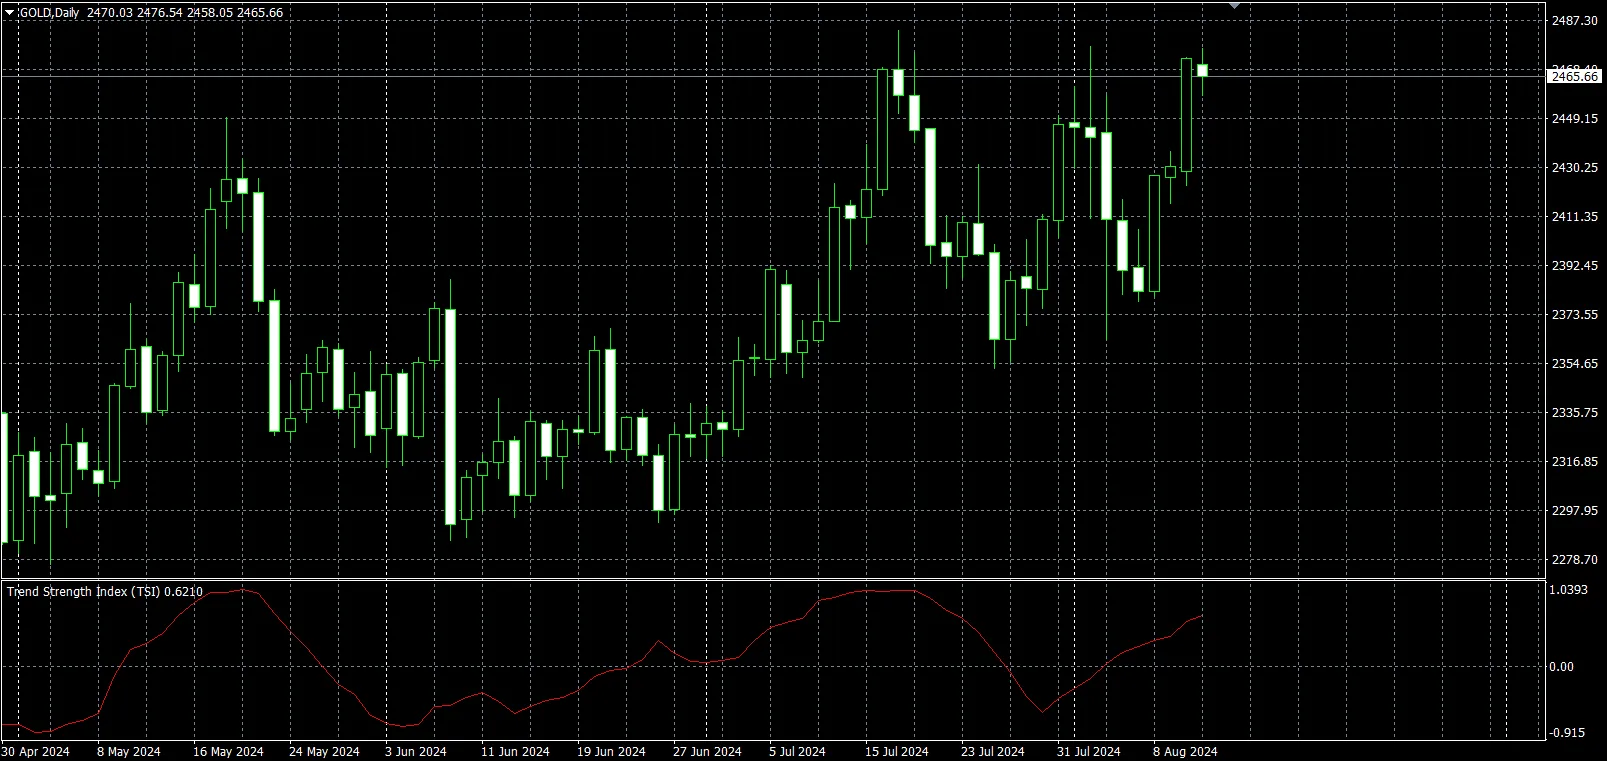
The Trend Strength Index (TSI) is a powerful tool for gauging the strength of current market trends....
Swing High/Low Identifier The Swing High/Low Identifier is a tailor-made indicator for MetaTrader 5...
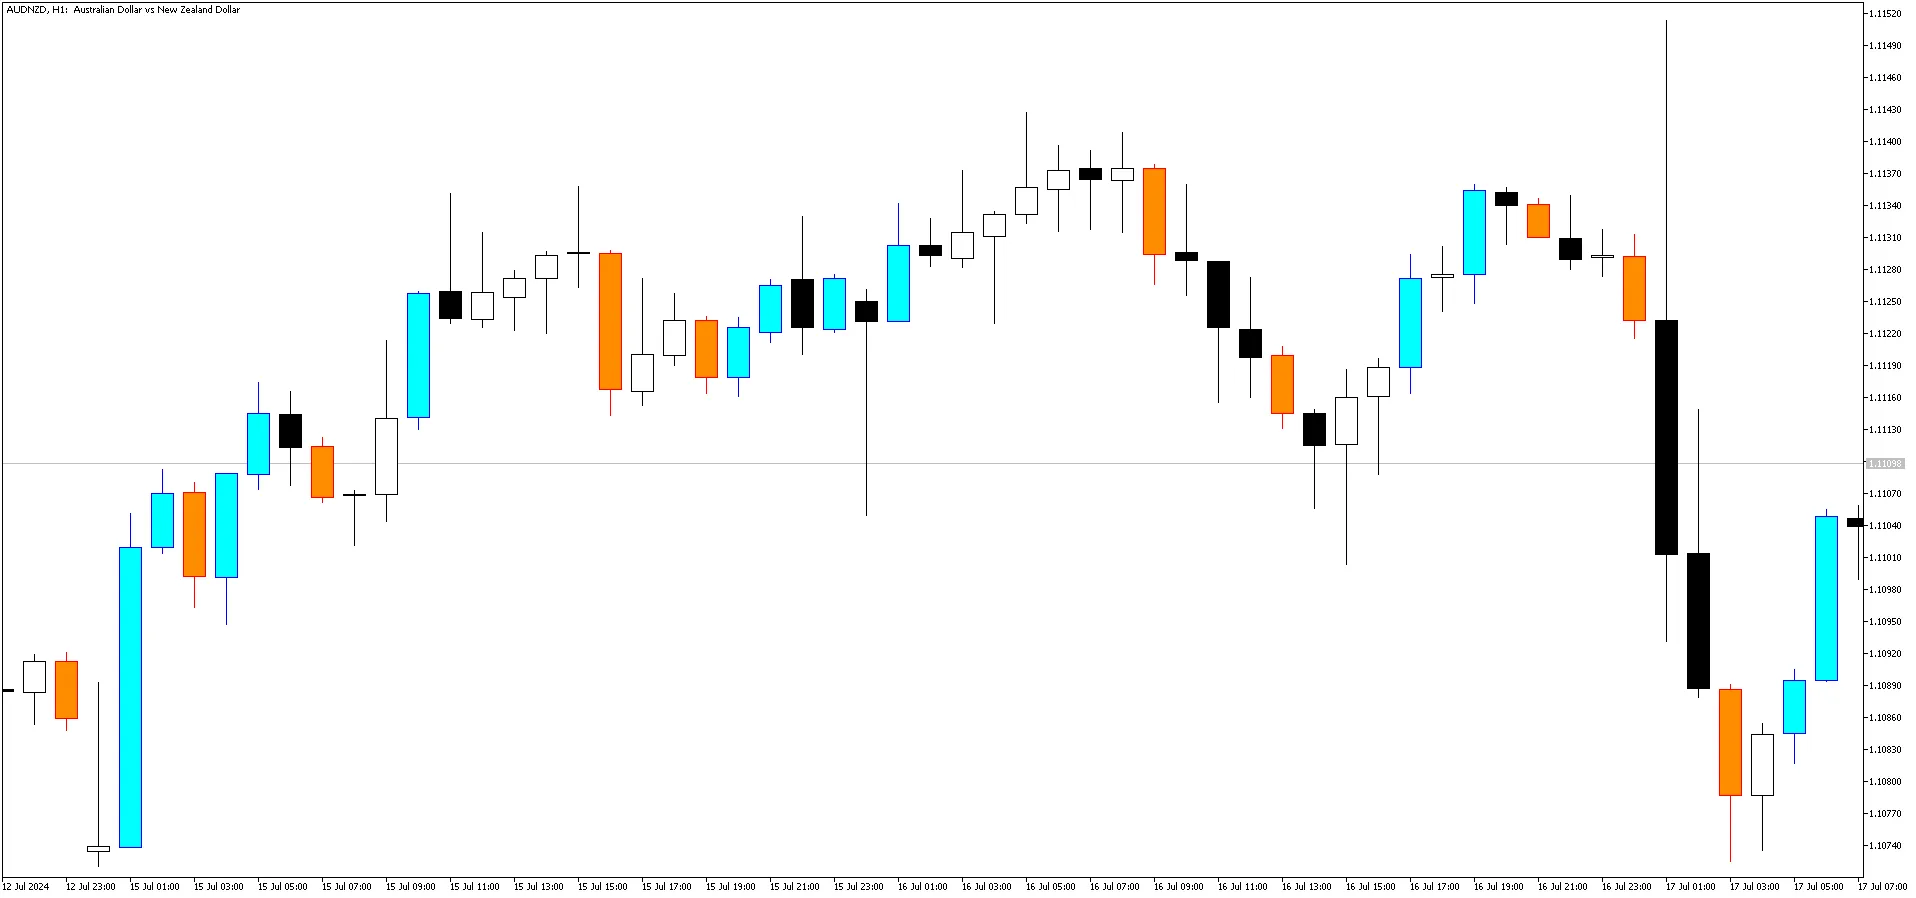
When it comes to trading, understanding candle patterns is crucial. The Decision Colored Candles ind...
Hey there, fellow traders! Today, we’re diving into a neat trick that lets you tweak the objects in ...
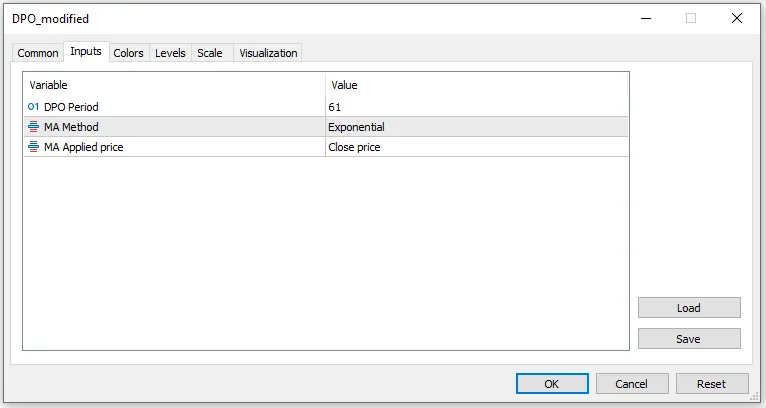
The Modified DPO (Detrended Price Oscillator) is a handy tool for traders using MetaTrader 4. This v...
If you're looking to enhance your trading strategy, the Modified Detrended Price Oscillator (DPO) is...
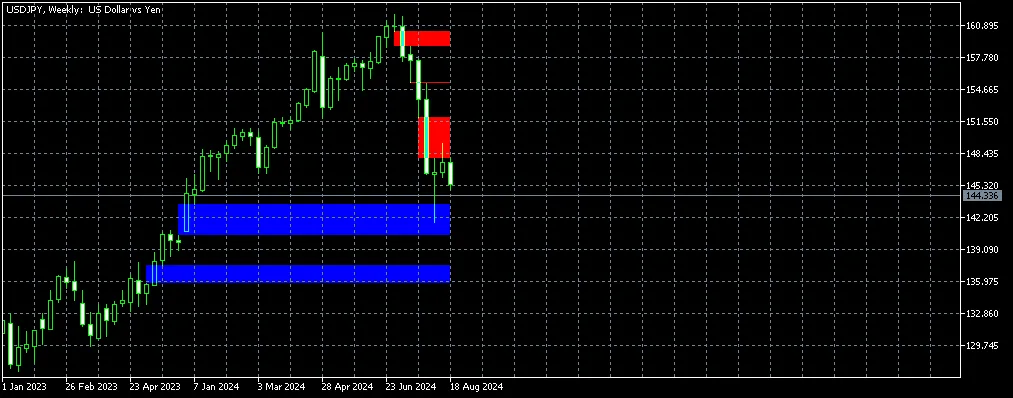
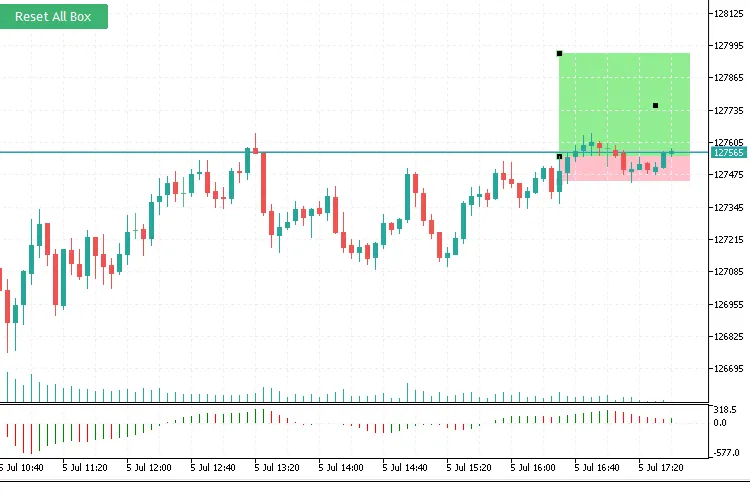
If you're looking to enhance your trading strategy, the Risk/Reward Box Indicator for MetaTrader 5 i...
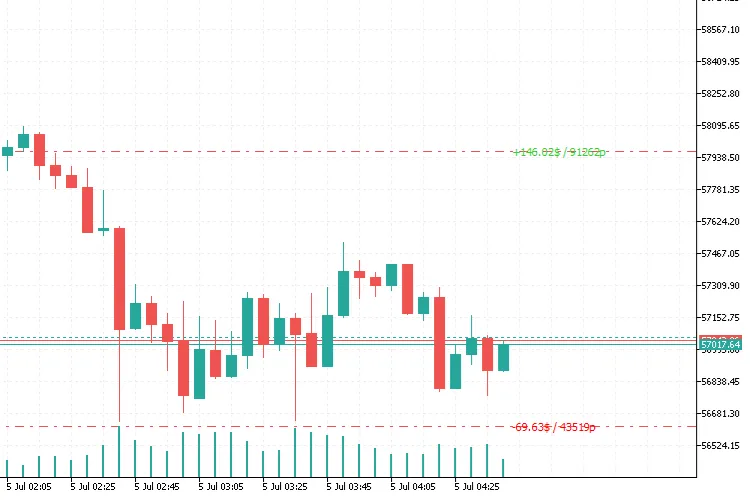
If you’re trading on MetaTrader 5, you’ve probably heard about SL-TP values. This handy indicator sh...
If you're looking to enhance your trading strategy with some powerful tools, let me introduce you to...
If you're diving into the world of trading with MetaTrader 4, you're going to want to get familiar w...
Welcome to Your CCI Journey! If you're diving into the world of trading, understanding indicators ca...
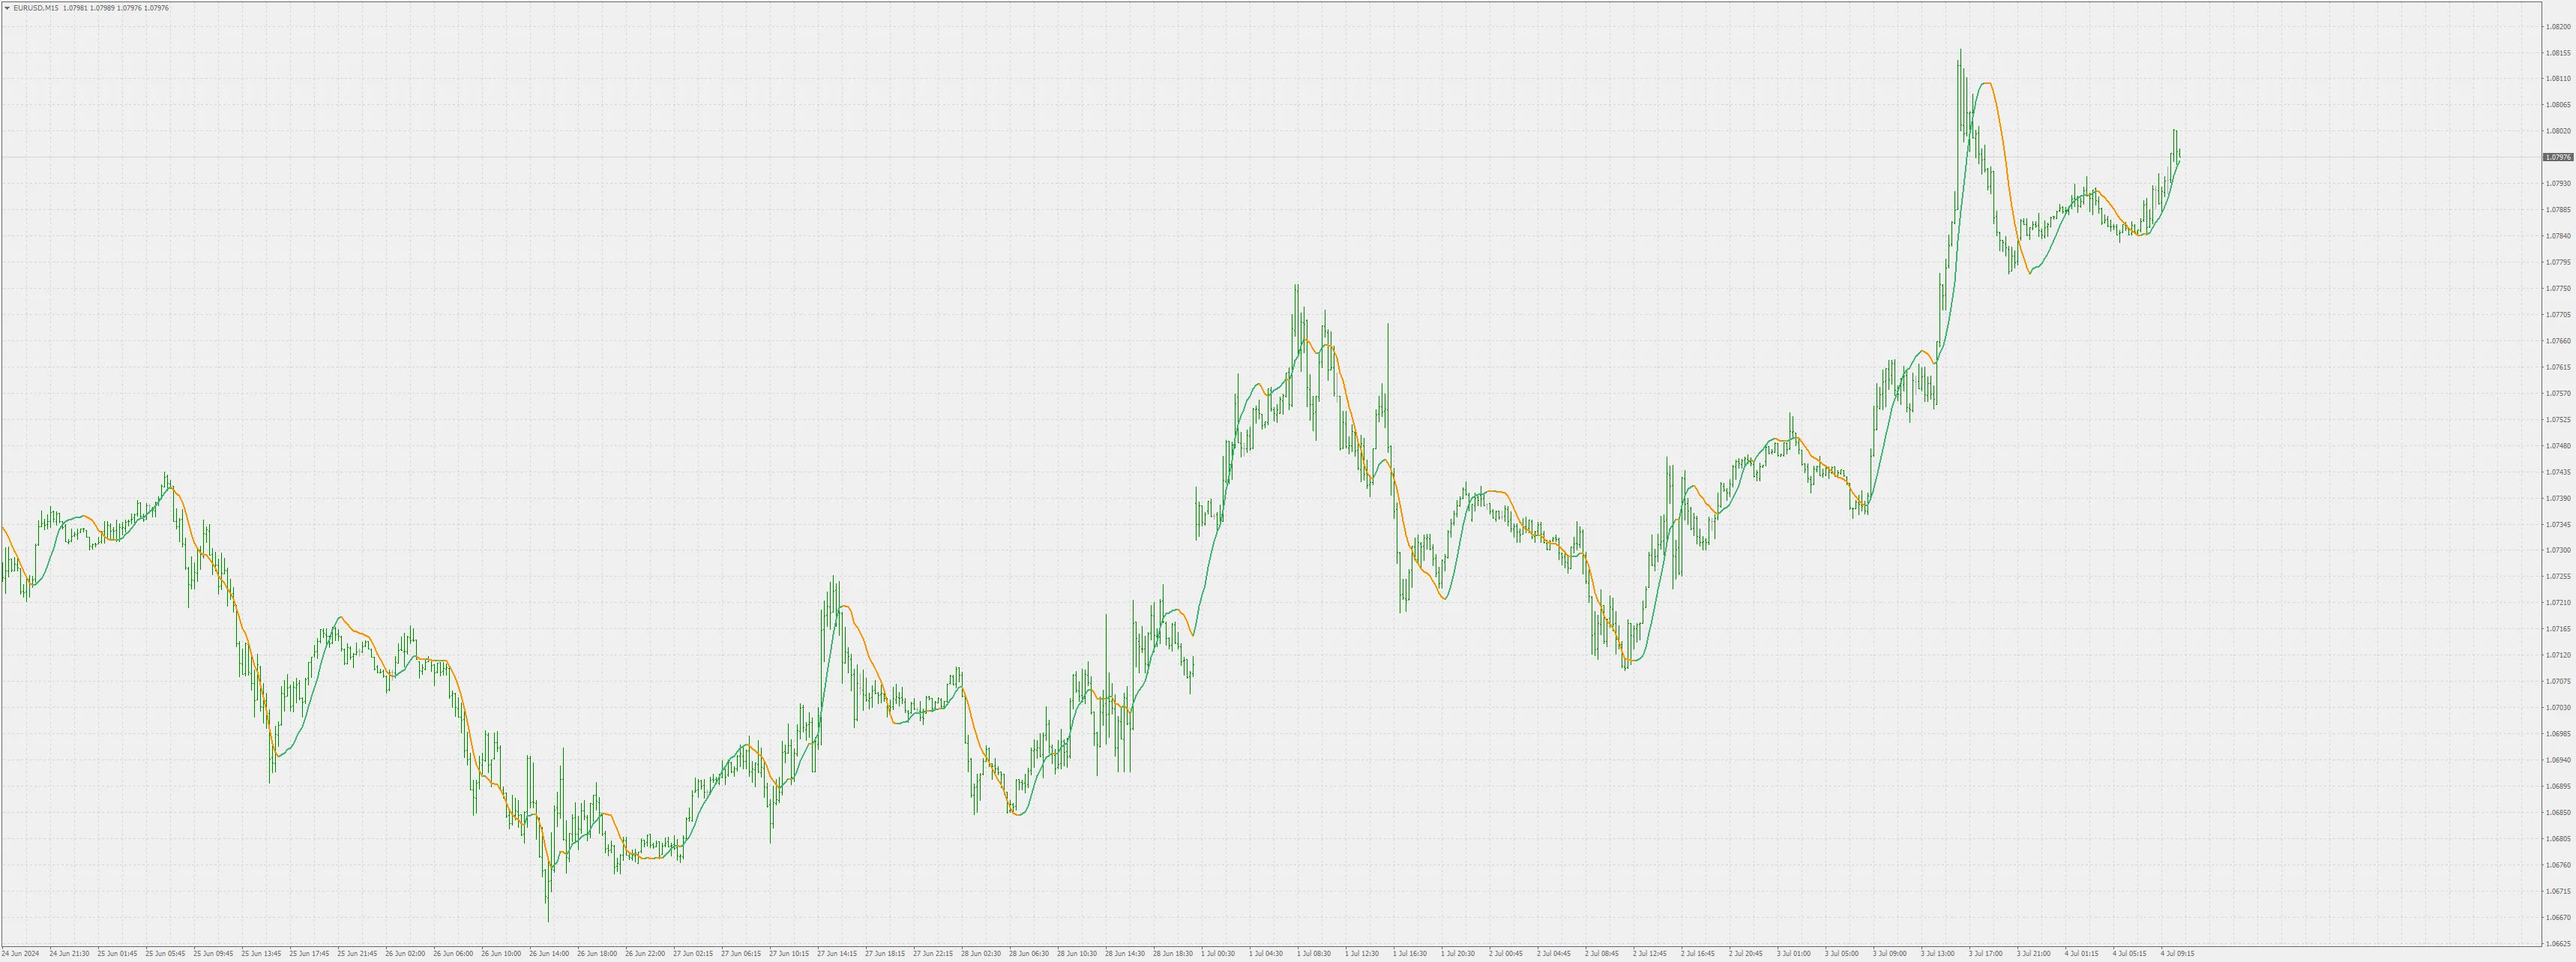
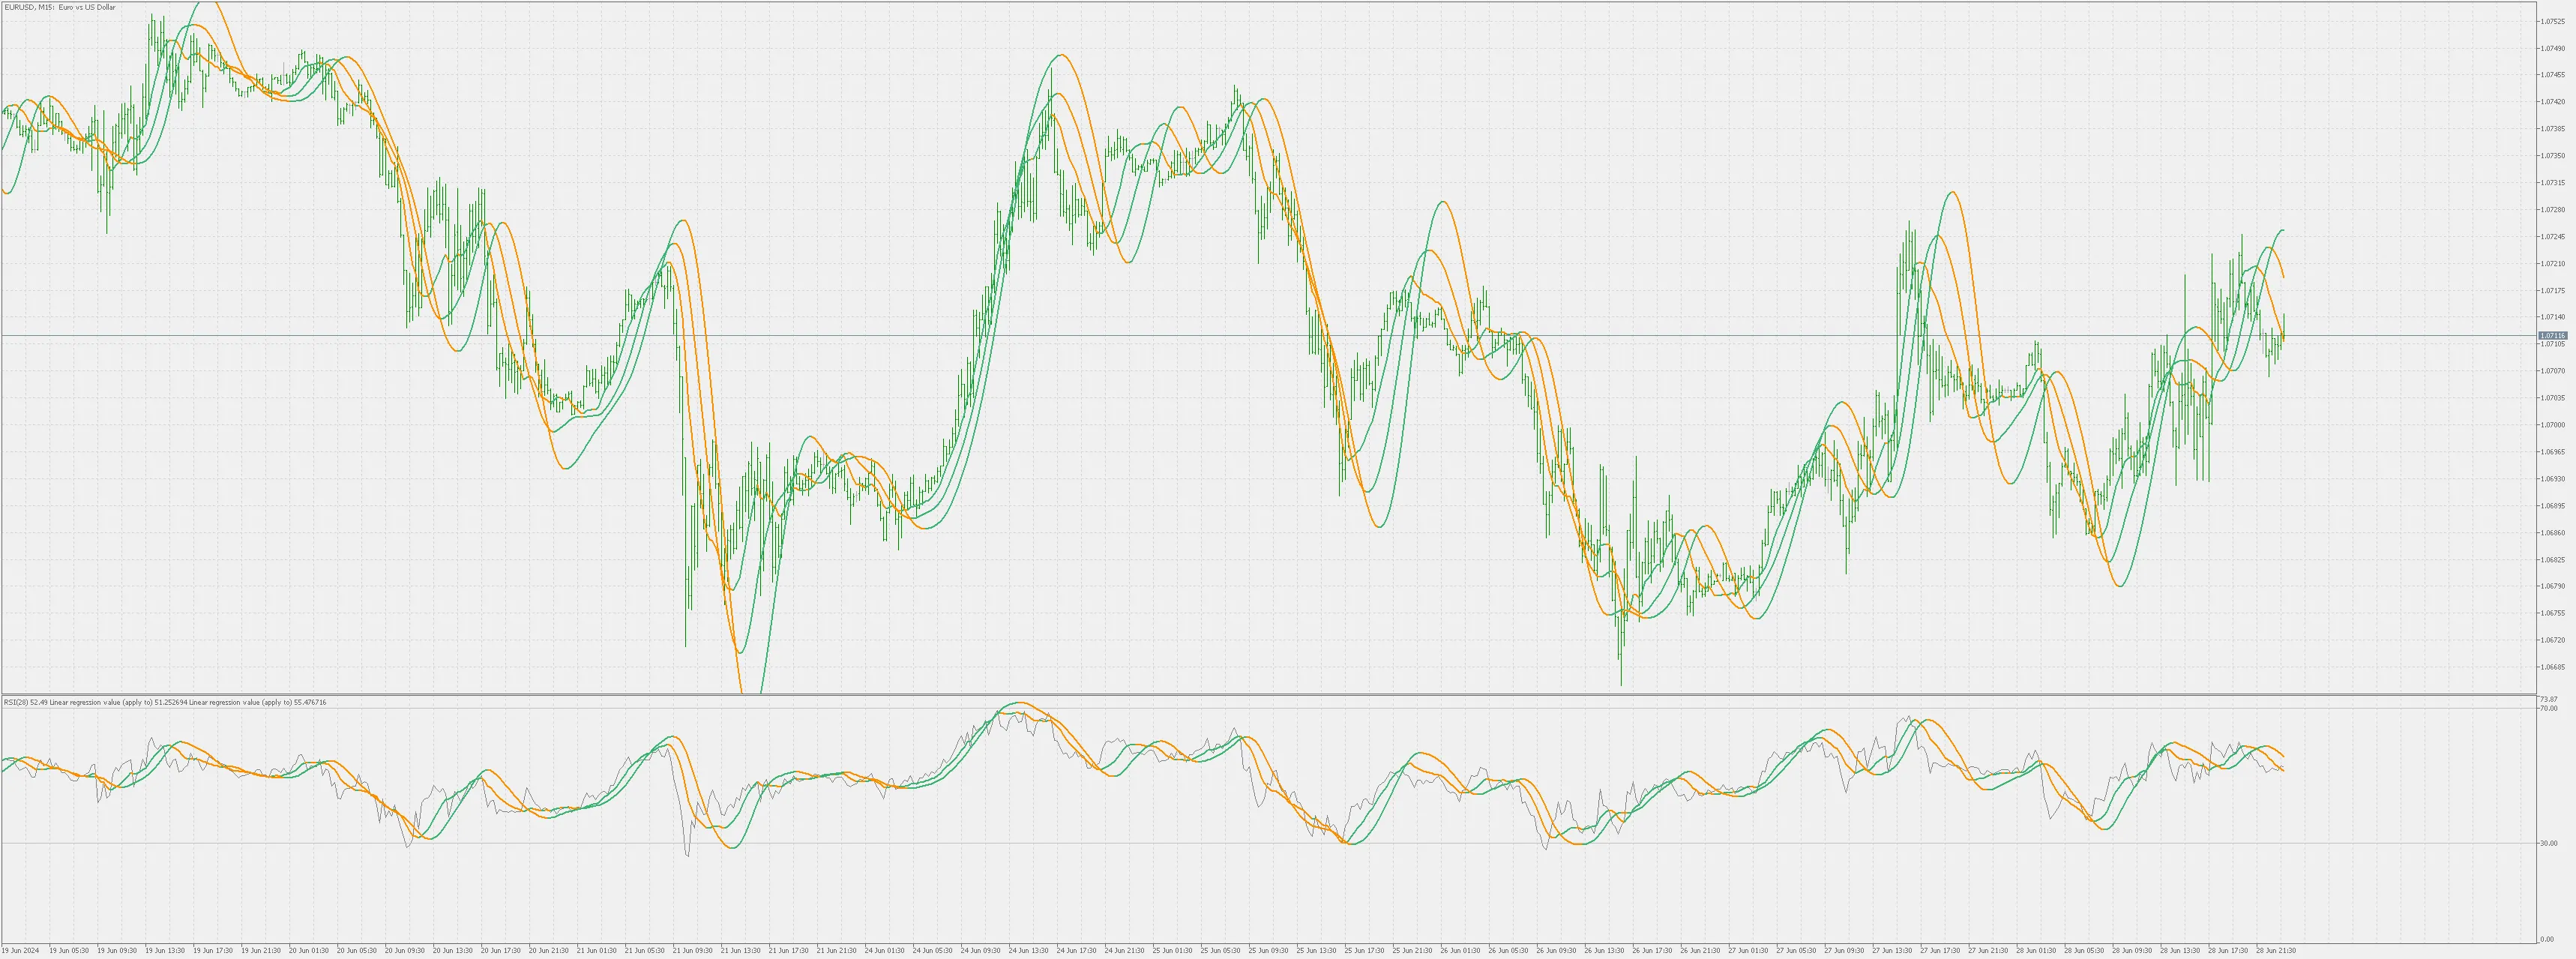
If you're diving into the world of trading and looking to enhance your strategies, the Linear Regres...
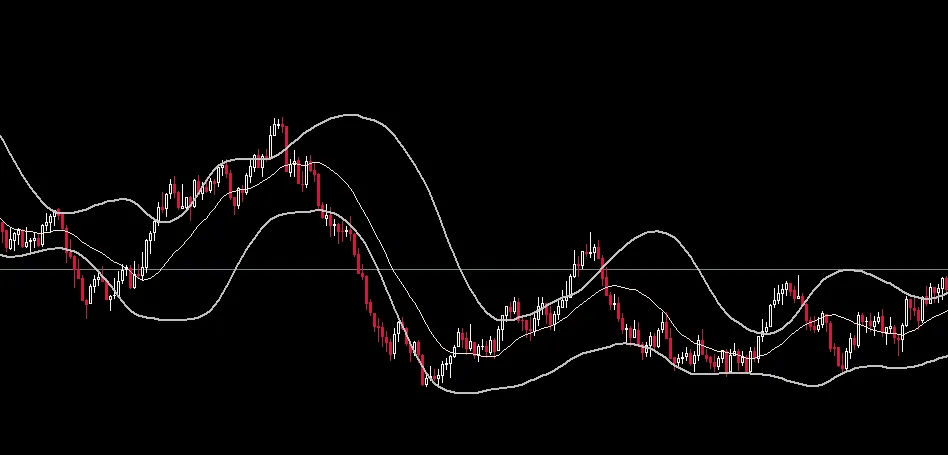
If you're looking to level up your trading game, let’s dive into an intriguing variation of the Boll...