Moving Average Candlesticks for MetaTrader 4 is a handy tool that visualizes standard moving average...
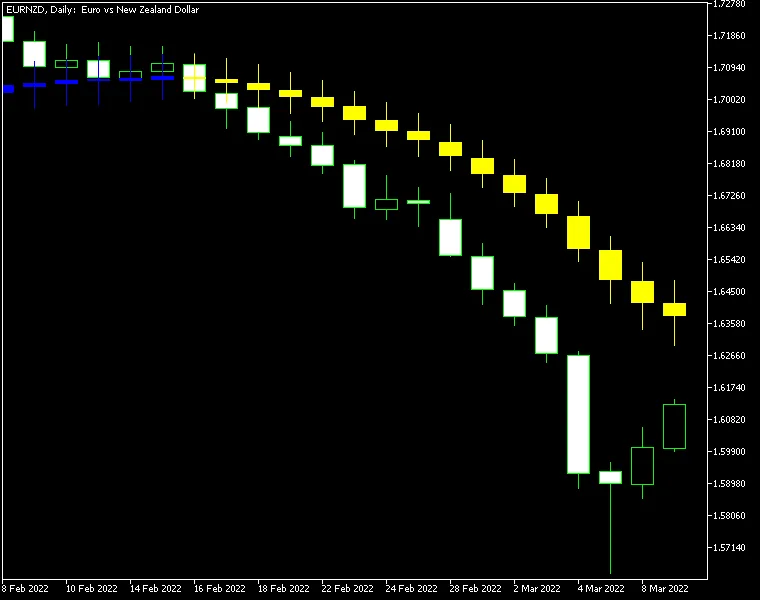
Moving Average Candlesticks Indicator for MT5 — This innovative tool gives you a fresh perspective o...
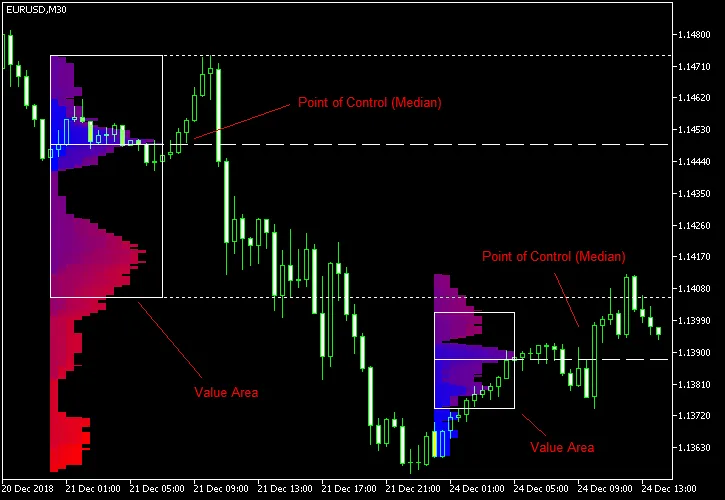
Discover the Market Profile Indicator for MetaTrader 5 — This classic Market Profile tool is designe...
Market Profile Indicator for MetaTrader 4 — This is a classic Market Profile tool that helps traders...
Introducing the Laguerre Indicator for MetaTrader — a fully custom indicator that breaks away from t...
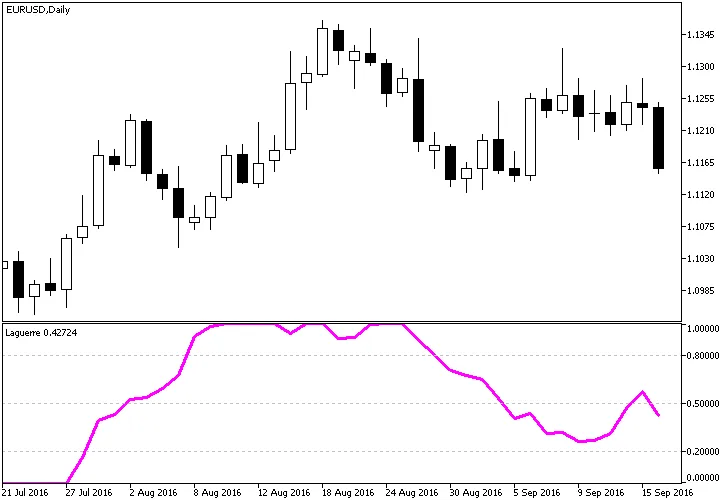
Discover the Laguerre Indicator for MetaTrader 5 — a uniquely crafted tool that steps away from the ...
The Keltner Channel: A Must-Have Indicator for Traders — Developed by Chester W. Keltner back in 196...
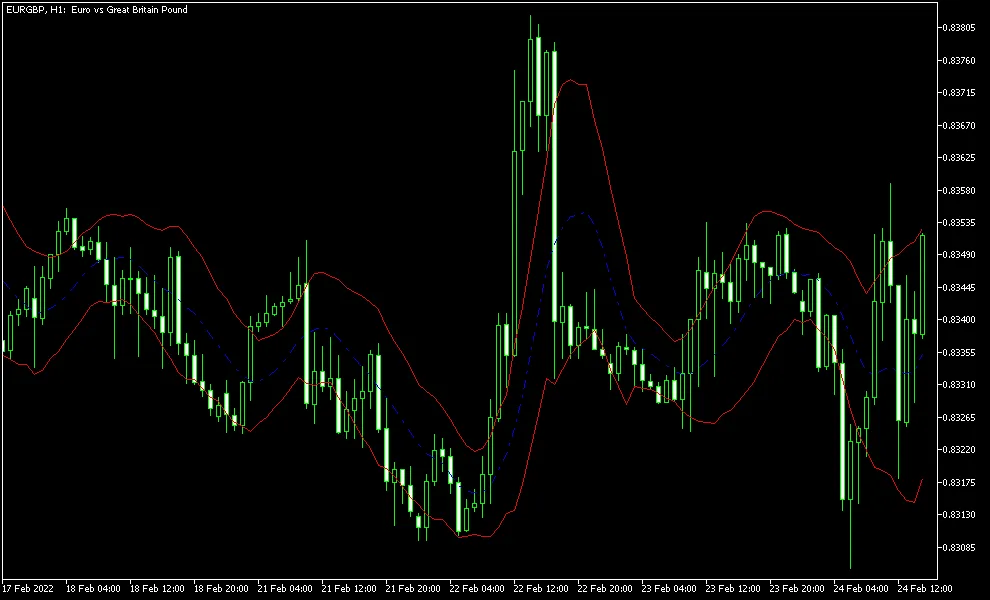
The Keltner Channel Indicator on MetaTrader 5 is a classic tool that traders have been using since i...
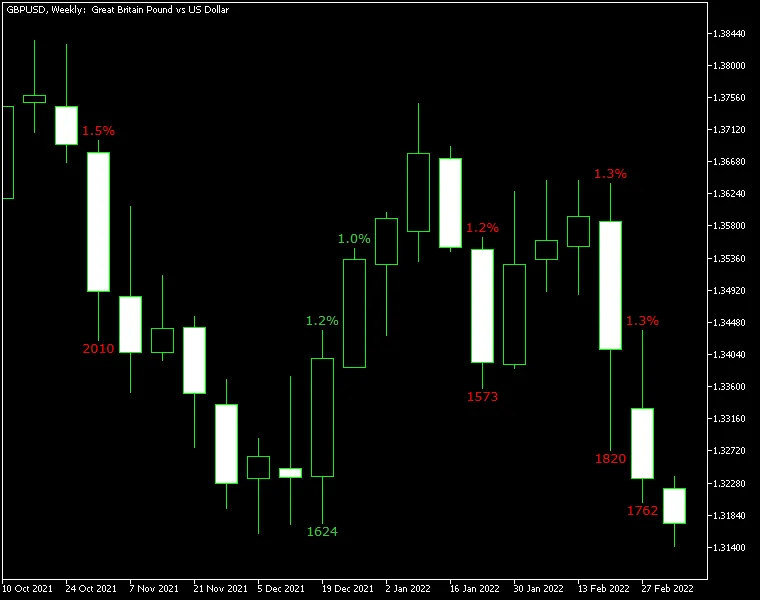
Gain/Loss Info Indicator for MetaTrader 5 is a powerful tool for traders who want to keep tabs on th...
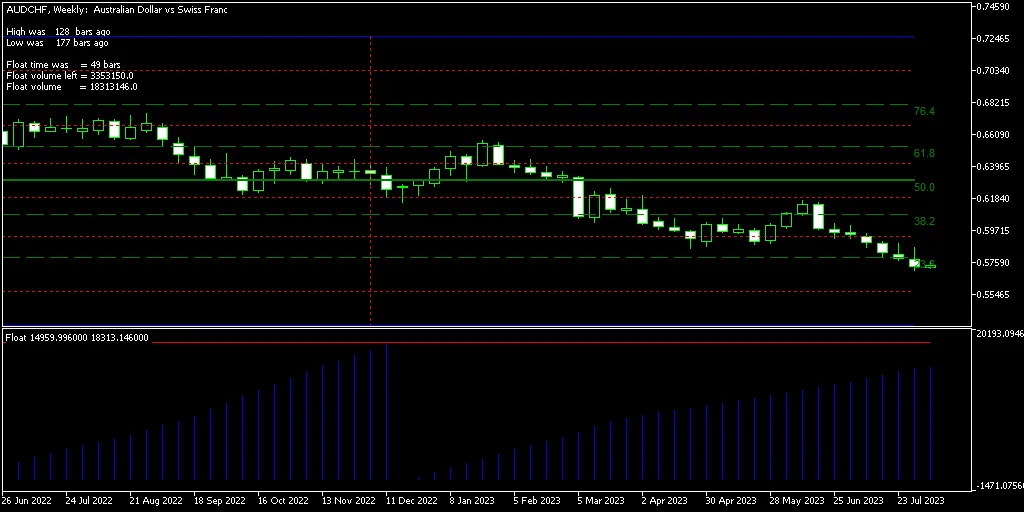
Float MetaTrader Indicator is a powerful tool designed for traders who want to dive deep into the tr...
Gain/Loss Info Indicator for MetaTrader — This handy tool helps you keep tabs on your trading perfor...
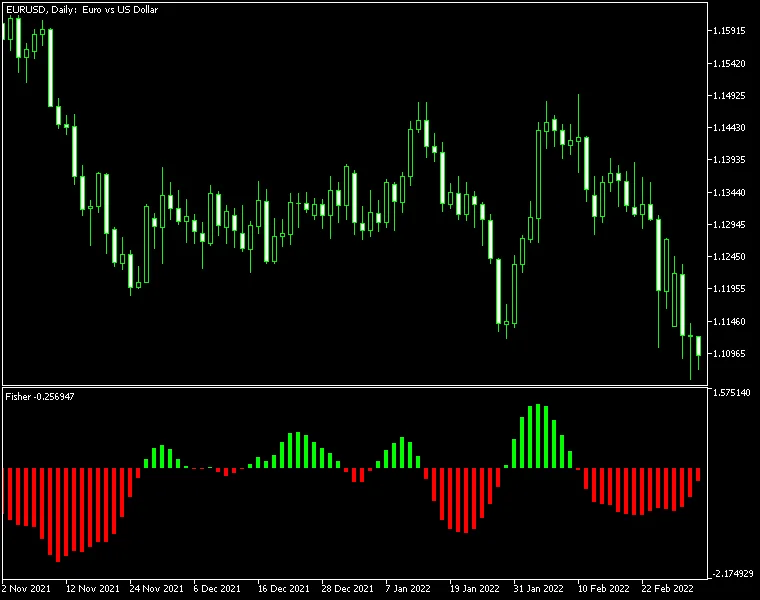
The Fisher Indicator for MetaTrader 5 is a straightforward yet powerful histogram tool that helps yo...
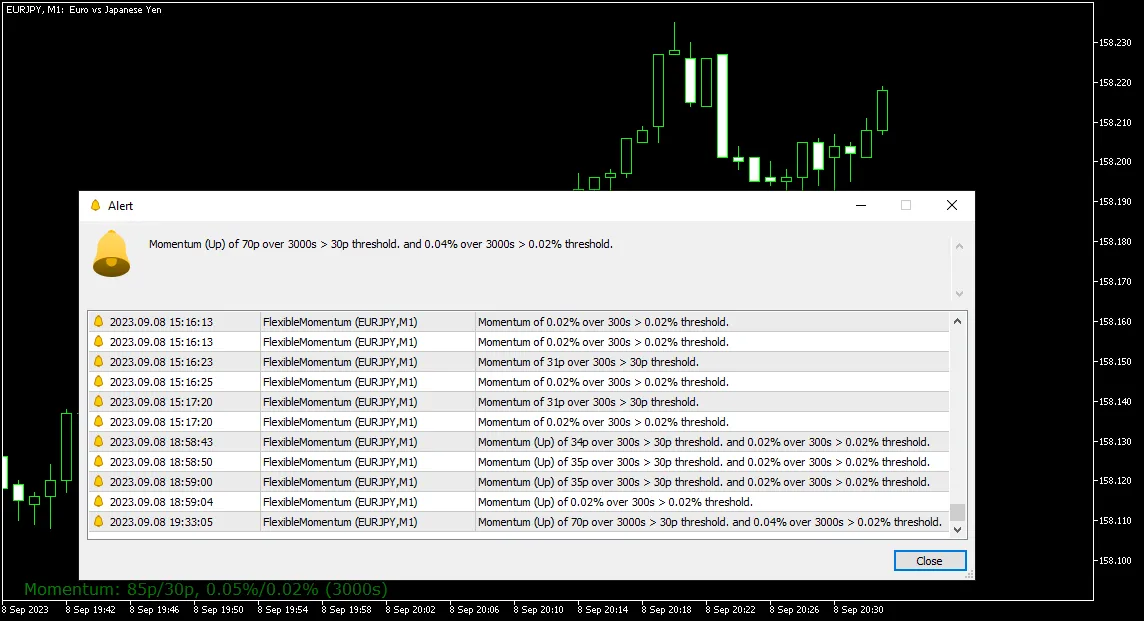
Flexible Momentum (MT5 Indicator) is a powerful tool designed for traders using MetaTrader 5. It cal...
Discover the Float Indicator for MetaTrader 4 — a powerful tool designed for traders who want to enh...
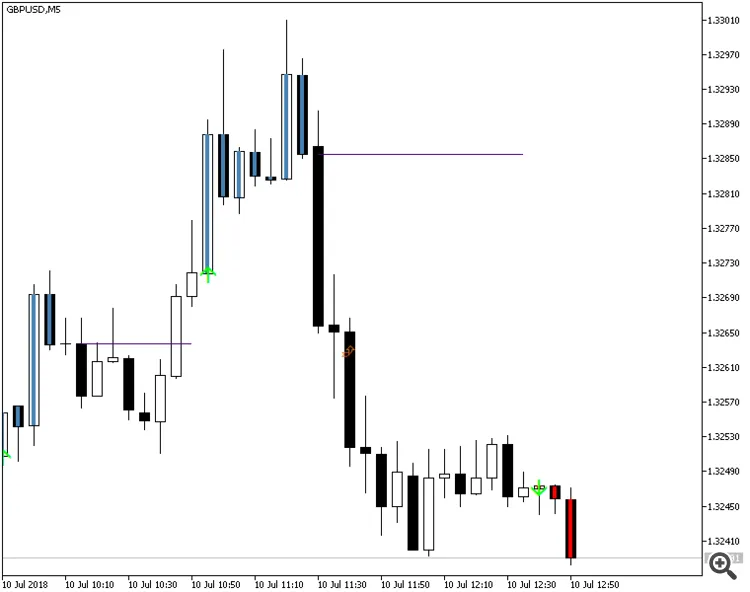
Easy Trend Visualizer is a nifty indicator for MetaTrader 5 that does exactly what it promises. It i...
The Fisher Indicator is a straightforward histogram tool designed to help traders identify the direc...
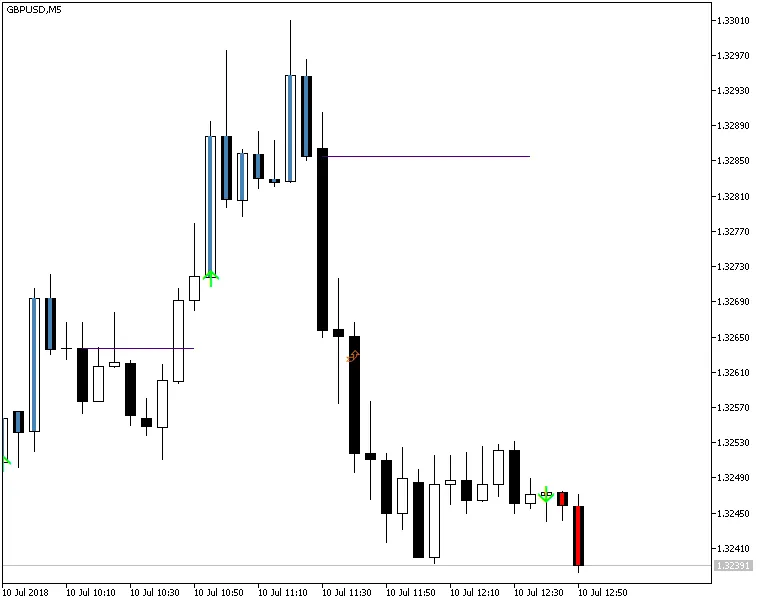
Easy Trend Visualizer is your go-to indicator for MetaTrader 4 that does just what it says on the ti...
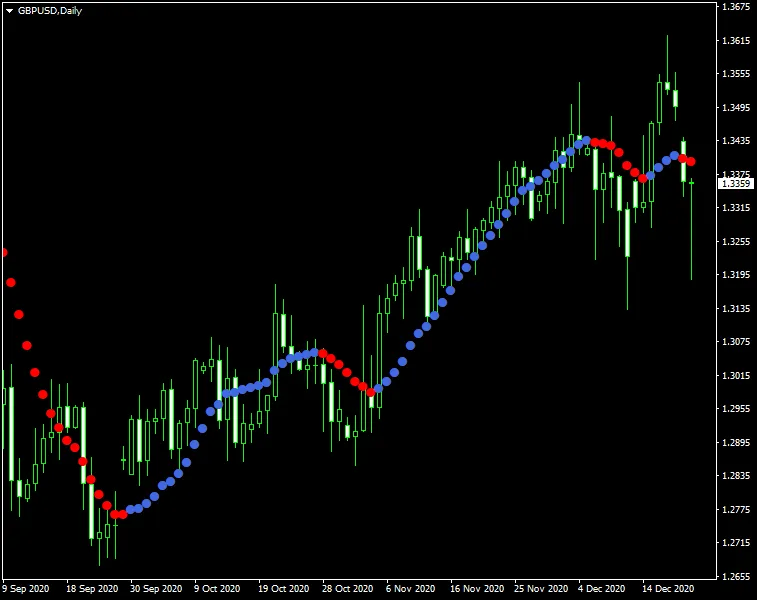
Understanding the Dots Indicator for MetaTrader 5 The Dots Indicator is a fantastic tool for traders...
Dots Indicator for MetaTrader 4 is a fantastic tool that helps traders identify the current trend di...
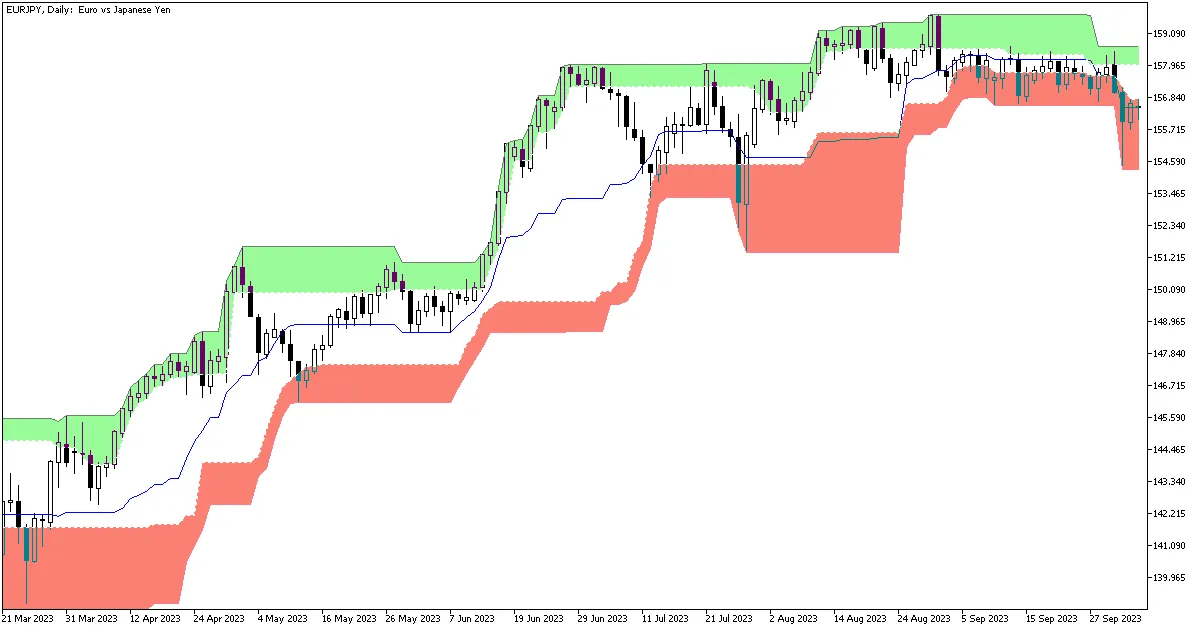
Introducing the Donchian Ultimate Indicator for MT4 – this isn't just your run-of-the-mill Donchian ...