Technical Indicator

Mastering the DailyHighLow Indicator for MetaTrader 5
MetaTrader5
Mastering the DailyHighLow Indicator for MetaTrader 5

Features and FunctionalityThe DailyHighLow indicator is a handy tool that plots two essential lines on your chart: one for the high price and another for the low price, based on user-defined settings. Here are its standout features:Customizable Timeframe: You can choose your preferred timeframe—be it daily, hourly, or something else—using the TimeFrame setting, which defaults to PERIOD_D1 (daily). The indicator makes sure that the selected timeframe is not smaller than your current chart timeframe, keeping your data accurate.Price Calculation Options: With the Price input, you can select from three modes:Low/High (DHL_LOWHIGH): This option shows the highest and lowest prices of your chosen timeframe.Open/Close (DHL_OPENCLOSE): This mode plots the highest and lowest of the open and close prices.Close/Close (DHL_CLOSECLOSE): Here, you’ll see the highest and lowest closing prices.Previous Period Option: The Previous setting (default: true) lets you display the high/low values from the previous period, which can be great for historical analysis.Visual Customization: The indicator uses solid silver lines for both the high and low plots, with a width of 1, providing clear visibility without cluttering your chart.How It WorksThe indicator kicks into gear by initializing two buffers—HighBuffer and LowBuffer—to store and display high and low price levels. During initialization (OnInit), it sets these buffers and checks the timeframe. The heart of the operation lies in the OnCalculate function, processing price data for each bar:Data Preparation: It sets up arrays for time, open, close, high, and low prices for reverse indexing.Timeframe Alignment: The indicator calculates bar shifts using iBarShift to ensure alignment with your chosen timeframe.Price Calculation:For DHL_LOWHIGH, it directly retrieves high and low prices using iHigh and iLow.For DHL_OPENCLOSE and DHL_CLOSECLOSE, it finds the highest/lowest open or close prices in the timeframe using iHighest and iLowest.Previous Period Handling: If the Previous option is enabled, calculations shift to the earlier period, offering historical context.Optimization: The indicator limits calculations to new or updated bars (limit) for efficiency, avoiding unnecessary processing.Practical ApplicationsThe DailyHighLow indicator is perfect for traders using strategies based on critical price levels, such as:Support and Resistance: Spotting daily or custom timeframe high/low levels to identify breakout or reversal opportunities.Trend Analysis: Assessing current price action against previous highs and lows to determine market direction.Risk Management: Setting stop-loss or take-profit levels based on significant price points.Usage InstructionsInstallation: To get started, add the indicator to your MetaTrader 5 platform by copying the code into the MQL5/Indicators folder and compiling it.Configuration:Set your desired TimeFrame (like PERIOD_D1 for daily levels).Choose a Price mode (DHL_LOWHIGH, DHL_OPENCLOSE, or DHL_CLOSECLOSE) that aligns with your trading strategy.Toggle the Previous option to switch between current and previous period data.Chart Application: Simply attach the indicator to any chart, and you’ll see two silver lines indicating the high and low levels.ConclusionThe DailyHighLow indicator is an effective tool for MQL5 traders, offering flexibility in terms of timeframe and price calculation methods. Its lightweight nature and efficient processing make it a great fit for both novice and seasoned traders looking to step up their technical analysis game.FeedbackIf you have any suggestions or run into issues, please drop a comment on the MQL5 CodeBase page or connect with me through the MQL5 community. Your feedback is crucial for enhancing this tool!Contact me: MQL5 Link

2025.05.17
Unlock Trading Success with Custom MACD: Real-Time Alerts for Your Phone
MetaTrader5
Unlock Trading Success with Custom MACD: Real-Time Alerts for Your Phone

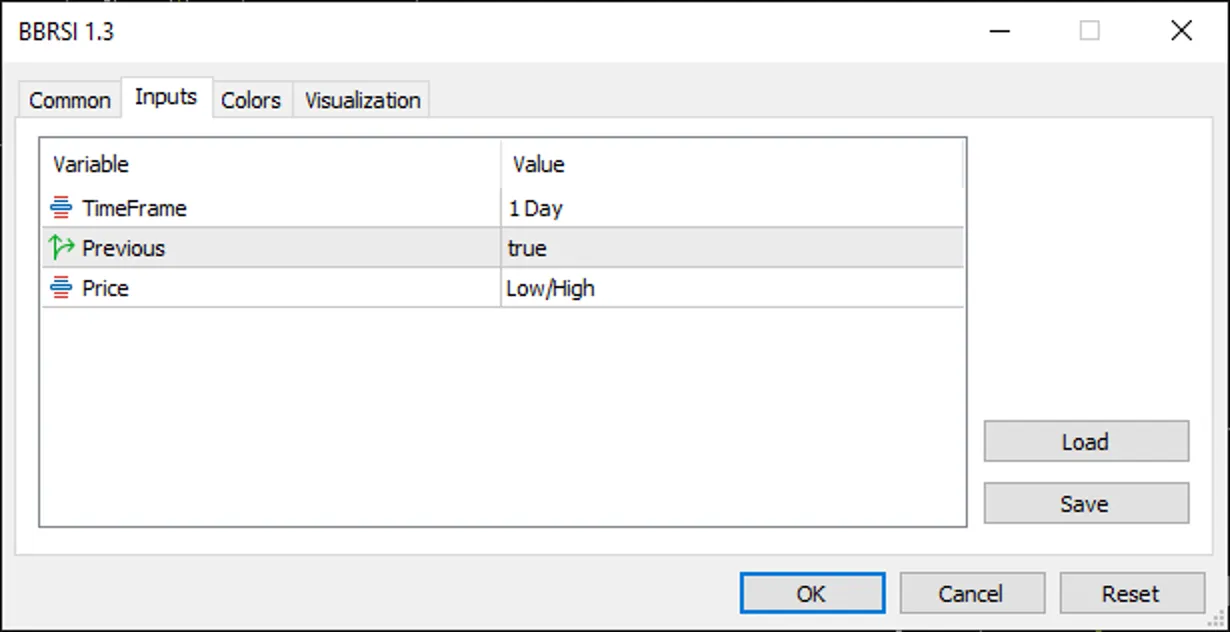
Introduction Hey fellow traders! If you’re looking to take your trading game up a notch, let me introduce you to the Custom MACD. This isn’t just your average Moving Average Convergence Divergence (MACD) indicator; it’s a turbocharged version designed for MetaTrader 5. Not only does it harness the classic MACD's ability to spot trends and reversals, but it also packs a game-changing feature: real-time signal alerts that ping straight to your phone! With its open-source code and user-friendly setup, it’s perfect for both newbies and seasoned pros alike. How Custom MACD Works So, how does the Custom MACD work? It follows the traditional MACD formula: MACD Line: The difference between the Fast EMA (default: 12) and Slow EMA (default: 26). Signal Line: The Simple Moving Average of the MACD line (default: 9). Histogram: The difference between the MACD and Signal Line, providing a quick look at market momentum. Visually, you’ll see: MACD Line in vibrant Dodger Blue. Signal Line in eye-catching Orange. Histogram in lively Lime Green, giving you insight into trend strength. Key Differentiator: Phone Signal Alerts What truly sets Custom MACD apart from the standard MACD in MetaTrader 5? It’s the real-time alerts! Here’s what you can expect: Instant Alerts: When a Bullish Crossover (that’s when the MACD crosses above the Signal Line, signaling a buy) or a Bearish Crossover (the MACD crossing below the Signal Line, signaling a sell) happens, you’ll get a notification sent directly to your phone via MetaTrader 5 (just make sure you set up push notifications on your MT5 app). Boosted Trading Efficiency: With these instant alerts, you can jump on market movements, even when you’re away from your trading station. While the default MACD only gives you on-chart data without any automatic alerts, Custom MACD keeps you plugged into the market, fine-tuning your trading strategy. Key Features Customizable Parameters: Fast EMA period (InpFastEMA, default: 12). Slow EMA period (InpSlowEMA, default: 26). Signal SMA period (InpSignalSMA, default: 9). Enable/disable alerts (ShowAlerts, default: true). User-Friendly Interface: Optimized colors and line thicknesses for easy signal spotting across any timeframe. Open-Source Code: Easily tweak it to add features like signal arrows or integrate with other indicators. High Performance: Fine-tuned for smooth operation on MetaTrader 5, even with large data sets. Benefits for Traders Never Miss an Opportunity: Get instant phone notifications for buy or sell signals, enabling quick action. Flexible for All Strategies: Whether you’re scalping, day trading, or swinging, Custom MACD works great across all currency pairs and timeframes. Enhanced Accuracy: Combine MACD signals with other tools (like SMA or RSI) to confirm trends and cut down on false signals. Community-Oriented: Built for sharing on the MQL5 Code Base, allowing you to give back to the trading community. How to Use Installation: Download Custom MACD from the MQL5 Code Base. Compile the file in MetaEditor and drag the indicator onto a MetaTrader 5 chart. Set Up Push Notifications: In MetaTrader 5, head to Tools > Options > Notifications and configure push notifications for the MT5 mobile app. Ensure that ShowAlerts is enabled in the indicator’s input parameters. Trading Strategy: Buy: When the MACD crosses above the Signal Line (Bullish Crossover) and the Histogram goes positive. Sell: When the MACD crosses below the Signal Line (Bearish Crossover) and the Histogram turns negative. Combine with support/resistance levels or other indicators for added reliability. Why Choose Custom MACD? The Custom MACD isn’t just another indicator—it’s a robust tool that keeps you in sync with the market 24/7. The phone alert feature is a major upgrade from the default MACD, saving you time and boosting your profits. Plus, its open-source design and flexible customization make it a fantastic choice for traders eager to enhance their performance. Conclusion Ready to level up your trading? Download the Custom MACD from the MQL5 Code Base today and experience the power of MACD with real-time alerts! If you have any questions or want to customize additional features, drop a comment or reach out. Let’s elevate your trading journey together! Author: Duy Van NguyContact: MQL5 LinkVersion: 1.00Updated: May 11, 2025

2025.05.11
Mastering the Multi-Day Dynamic VWAP Indicator for MetaTrader 5
MetaTrader5
Mastering the Multi-Day Dynamic VWAP Indicator for MetaTrader 5

Hey fellow traders! Today, let’s dive into a powerful tool that can enhance your trading game: the Multi-Day Dynamic VWAP (Volume Weighted Average Price) indicator for MetaTrader 5. This nifty little indicator plots a dynamic VWAP level that starts from the daily timeframe, but you can fully customize the timeframe in the settings to suit your trading style. The cool thing about this indicator is its ability to calculate the VWAP over multiple days. Think of it as an anchored VWAP, but with more flexibility. It’s a great asset for pinpointing key support and resistance levels, confirming trends, and spotting mean reversion signals. Plus, it displays market close prices using Heiken Ashi trends, making it easier for you to visualize bullish and bearish momentum. So, what exactly is VWAP? In simple terms, it represents the average price weighted by volume over a chosen time period. Unlike regular averages, it shows you where the majority of volume has traded, which is crucial for institutional traders. When you're scanning for signals using VWAP, remember that it’s typically more effective to see how the market price acts in relation to the VWAP rather than just entering a trade at the VWAP level itself. Trend Support and Resistance Downtrend: VWAP serves as resistance when the current price is below VWAP.Price below VWAP = sellers are in control. Uptrend: VWAP functions as support when the current price is above VWAP.Price above VWAP = buyers are in control. Momentum When hunting for trade signals with VWAP, it’s wise to focus on how the price moves away from the VWAP level. Here’s what to look for: If price is shifting strongly away from VWAP in the trend's direction, it often indicates momentum continuation or a strong directional bias. This movement suggests that market participants are committing capital and adjusting perceived value, revealing high-conviction trading opportunities. Breakout Signals Bullish Breakout:If the price breaks above VWAP, consider it a potential buy signal, indicating buyers are stepping in. Bearish Breakout:If the price breaks below VWAP, it signals a potential sell opportunity as sellers take charge. Mean Reversion in Ranging Markets In sideways or consolidating markets, prices often retrace back to VWAP. This can present high-probability counter-trend trades and mean reversion setups.  

2025.05.08
Master Trend Changes with Custom MA Cross and RSI Indicator for MT5
MetaTrader5
Master Trend Changes with Custom MA Cross and RSI Indicator for MT5

View Indicator Chart Hey there, fellow traders! If you're looking for a powerful tool to help you spot trend changes and filter your entries based on momentum, you’re in for a treat! The Custom MA Cross with RSI Indicator for MT5 is just what you need. This nifty indicator combines two moving averages with the Relative Strength Index (RSI) to deliver clear buy and sell signals right when you need them. Key Features: Customizable Moving Averages: Choose your preferred type (SMA, EMA, etc.), periods, and price source for each moving average. Crossover Alerts: Get instant visual and optional sound alerts when the fast MA crosses above or below the slow MA. RSI Filter: The indicator only displays signals when the RSI is above or below user-defined levels, helping you dodge those pesky false entries during weak trends. On-Chart Signals: Buy and sell arrows pop up directly on your chart at the crossover point, provided RSI conditions align. User-Friendly Settings: Whether you’re just starting out or you’re a seasoned pro, the simple input options make this tool accessible to all. How It Works: The indicator keeps an eye on two moving averages. When the fast MA crosses above the slow MA and the RSI is above your set level, a buy signal is triggered. Conversely, if the fast MA crosses below the slow MA and the RSI is below the defined level, you’ll see a sell signal. All these signals are clearly visible on your chart for easy reference. Benefits: Boosts your trend-following strategies. Helps filter out those choppy market conditions. Gives you the confidence to enter trades with clarity. This indicator is perfect for any timeframe and currency pair on the MetaTrader 5 platform. Plus, you can personalize it with colors that suit your style!

2025.04.28
Understanding Spreads: A Key Indicator for MetaTrader 5 Traders
MetaTrader5
Understanding Spreads: A Key Indicator for MetaTrader 5 Traders

What is Spread in Trading? In the trading world, a spread refers to the difference between the bid and ask prices of two symbols. When the quotes of these symbols move in opposing directions, the second symbol is reversed. Essentially, the spread is calculated based on the sum of these quotes. Using the Spread Indicator It's important to note that only the quotes of the second symbol in the spread are reversed. The variable names are straightforward, making it easier for traders to grasp their meanings. This indicator is essential when both symbols of the spread are actively traded — particularly within the timeframe of trading sessions. Trading with Spreads: Strategies When it comes to spread trading, you can adopt a few strategies: Flat Trading: If the spread increases, consider selling; if it decreases, think about buying. Support and Resistance Levels: Look for trading opportunities around these levels after the spread chart crosses them. Setting Up Your Indicator The code for the spread indicator is thoroughly commented, making it user-friendly. When setting up the indicator for the first symbol of the spread, you'll use variables to convert to integers for easier viewing and analysis. For instance, if your quotes have five decimal places, you’ll set your multiplier to 100,000. Coefficient_to_an_integer1 = 100000; Coefficient_to_an_integer2 = 100000; input double Weighting_coefficients1 = 1;         // proportionality factor (position volume) of the first spread symbol input int Coefficient_to_an_integer1 = 100000   // number of quotation marks Sym 1 input string Symbol2 = "USDCAD"                  //second spread symbol input bool   Symbol2_Reverse = true              //inverse correlation input double Weighting_coefficients2 = 1         // proportionality factor (position volume) of the second spread symbol input int Coefficient_to_an_integer2 = 100000   // number of quotation marks Sym 2 Exploring Interpretation Variability There are numerous ways to interpret the values of the spread indicator and its movements. You can analyze breakdowns and bounces from levels, which gives you flexibility in strategy selection. For instance, tracking trends in the spread quotes can provide insights, especially when considering seasonal patterns. Classic Example: AUDUSD and USDCAD Spread Let’s take a closer look at a classic interpretation of the AUDUSD-USDCAD spread, where trading occurs within a defined range. You can also enhance your analysis by overlaying standard technical analysis figures and indicators, such as envelopes, on the spread chart to better visualize its values.

2025.04.17
Countdown 2.0: The Must-Have Indicator for MetaTrader 5 Traders
MetaTrader5
Countdown 2.0: The Must-Have Indicator for MetaTrader 5 Traders

Key Features 1. Flexible Display Modes: - Commentary: The countdown appears right in the top left corner of your chart. - Chart Edges: You can position the stopwatch in any corner of the chart, keeping it in a fixed view. - Near Price: The stopwatch dynamically follows the price in real-time, ensuring it’s always visible close to the market action. 2. Time Zone Compatibility: - Automatically adjusts to the Brasilia time zone (UTC-3), with automatic updates for daylight saving time (DST). 3. Smart Countdown: - Calculates the time remaining until the next candlestick when the market is open. - Calculates the time remaining until the next market open when closed, with adjustments for weekdays and weekends. 4. Full Customisation: - Choose the color, font size, and anchor point of the text to suit your style. - Set your preferred market opening and closing times. 5. Intuitive Interface: - Simple and well-documented input parameters make setup a breeze. How to Set Up 1. Installation: - Download the Countdown.mq5 file and place it in the Indicators folder of your MetaTrader 5. - Restart the terminal and add the indicator to your desired chart. 2. Input Parameters: - Timer Position: Pick between "Commentary", "Chart Borders", or "Next to Price". - Text Colour: Customize the timer color for better visibility. - Font Size: Adjust the text size to your liking. - Opening and Closing Times: Input your market's hours in HH:MM format (e.g. 09:00). 3. Usage: - When the market is open, the indicator shows the countdown until the next candlestick. - When the market is closed, it displays the time remaining until the next open. Benefits - Accuracy: Provides precise countdowns, considering time zones and automatic adjustments. - Versatility: Works seamlessly across any timeframe and financial asset. - Ease of Use: The user-friendly interface and clear parameters allow for quick setup. - Dynamic Visualization: The "Near Price" mode ensures the timer is always in sync with market action.

2025.04.17
Mastering Average Price Calculation with MQL5 Indicator for MetaTrader 5
MetaTrader5
Mastering Average Price Calculation with MQL5 Indicator for MetaTrader 5

MQL5 Indicator for Calculating the Average Price of a Hedge Account Introduction Hey there, fellow traders! Today, I want to share a nifty tool with you – an MQL5 indicator designed to calculate the average price of your hedge account effortlessly. I’ve tweaked the original code a bit and even posted a walkthrough video on YouTube for you to check out: As many of you know, trading with a hedge account lets you hold both long and short positions on the same asset simultaneously. A common challenge in this setup is figuring out the average price of your open positions. Well, this article walks you through an MQL5 indicator that automatically calculates that average price for any given symbol and Magic Number, and displays it right on your chart. How Does the Indicator Work? The indicator operates in a few straightforward steps: Filters all open positions in MetaTrader 5, checking against the symbol and Magic Number you set. Separates buy and sell trades to calculate the volume and total cost for each. Calculates the weighted average price, factoring in total volume bought and sold. Displays a line on the chart that indicates the average price of your net position. Code Breakdown 1. Calculating the Average Price The CalculateHedgeAveragePrice() function loops through all your open positions and: Sorts out buys from sells. Calculates the weighted average price for each direction. Identifies whether your net position is long or short. Returns the calculated average price. 2. Initializing the Indicator In the OnInit() function, we set up the buffer that will hold the average price to be displayed on your chart. 3. Filling the Buffer The OnCalculate() function updates the indicator buffer using ArrayFill(), which improves the efficiency of the code. How to Use in MetaTrader 5 Copy and paste the code into a new .mq5 file in the Indicators folder. Compile the code in MetaEditor. Add the indicator to your chart in MetaTrader 5. Set the Magic Number for the trades you want to keep an eye on. Conclusion This MQL5 indicator is a game changer for those of you working with hedge accounts. It makes keeping track of the average price of your open positions a breeze and can be tailored for various assets and strategies. Happy trading!

2025.04.17
Unlocking Better Volume: Your Go-To Indicator for MetaTrader 5
MetaTrader5
Unlocking Better Volume: Your Go-To Indicator for MetaTrader 5

Main Features Dynamic Volume Categorization: The indicator sorts volume into various categories, using distinct colors for easy visual interpretation: Buying Climax (clrCrimson): Highlights periods of exceptionally high volume with a price increase. Selling Climax (clrLimeGreen): Indicates strong selling pressure accompanied by high volume. Churn (clrGold): Captures high volatility without a clear price trend. Climax Churn (clrMagenta): Merges buy/sell climaxes with churn, showcasing extreme volatility. Weak Candle (clrDarkTurquoise): Identifies candles with low volume in the lookback period. Volume Balance (clrWhiteSmoke): Represents standard volume without any special characteristics, serving as a "base color" when no other patterns are present. Moving Average Volume: A smoothed moving average line (clrMaroon) helps you spot volume trends over time. Advanced Customization: Moving Average Period: Tailor the moving average period to fit your trading style. Lookback Window: Adjust the lookback window to compare current volume with recent values. Volume Type: Choose between real volume (VOLUME_REAL) or tick volume (VOLUME_TICK) based on the asset's characteristics. Clear Visual Interface: A colored histogram (DRAW_COLOR_HISTOGRAM) displays volume categories intuitively for quick analysis. Flexibility for Different Timeframes: This indicator works seamlessly across any timeframe, whether you're trading intraday or looking at weekly/monthly charts. How to Interpret the Signals Buy/Sell Climax: Marks strong accumulation or distribution moments, hinting at potential trend reversals or continuations. Churn: Reflects high volatility without a clear direction, indicating market uncertainty. Weak Candles: Represents low market activity, often seen during consolidations or indecision periods. Volume Balance: Shows normal market behavior, providing insights into stability without significant anomalies. Configuration and Use Better Volume is straightforward to set up and use: Add the indicator to your chart in MetaTrader 5. Adjust the parameters as needed: Moving Average Period: Controls the smoothness of the moving average line. Lookback Window: Sets the number of candles for comparison. Volume Type: Select between real volume or tick volume. Keep an eye on the signals from the histogram and moving average line to make informed trading decisions. Why Use Better Volume? Volume Flow Analysis: Gain insights into market participants' behavior based on volume trends. Pattern Identification: Spot buy/sell climaxes, churn, and other critical patterns that can guide your trading choices. Ease of Use: The intuitive visual interface and customization options make this indicator accessible for both beginners and seasoned traders. Application Example Utilize the indicator to confirm entry and exit signals within volume-based strategies. For more details, check out this chart example.

2025.04.17
First Previous 1 2 3 4 5 6 7 8 9 10 11 Next Last