Meet the 3MaCross EA, your new trading companion built on the robust 3MACross indicator. This expert advisor employs three moving averages (MAs) of different periods to pinpoint optimal entry and exit points. You’ve got the flexibility to customize the periods and choose the type of MA that suits your strategy—whether it's the simple moving average (SMA), exponential moving average (EMA), smoothed moving average (SMMA), or linear weighted moving average (LWMA).
The 3MaCross EA comes packaged in the 3MaCross_EA.mq4 file, alongside the necessary indicators: _3 MA Cross w_Alert v2.mq4 and Price Channel.mq4. The Price Channel indicator can assist in setting automatic stop losses (SL), making it a handy tool in your trading arsenal.

Before you dive in, it’s wise to test the EA on a demo account first. This way, you can fine-tune your settings without risking real capital.
| Symbol | EURUSD (Euro vs US Dollar) | ||||
| Period | 15 Minutes (M15) 2008.06.05 00:00 - 2008.07.08 17:15 | ||||
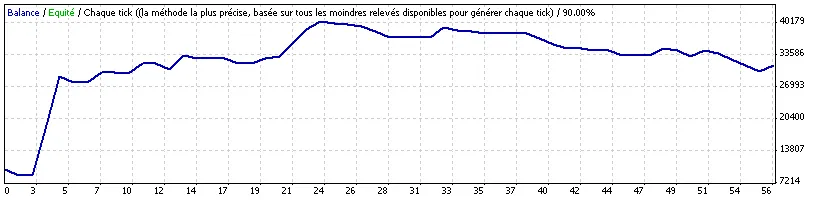
| Model | Every tick (the most precise method based on all available price movements) | ||||
| Parameters | Lots=4; StopLoss=30; AutoStopLoss=false; TakeProfit=0; TradeAtCloseBar=true; TrailingStop=0; TrailingStep=1; BreakEven=20; MagicNumber=0; CanAddPos=false; MaxOpenOrders=5; Repeat=3; Periods=5; UseAlert=false; SendEmail=false; TradeLog="3MaCross_EA"; Slippage=3; Indicator_Setting="---------- Indicator Setting"; FasterMA=2; FasterShift=0; FasterMode=2; MediumMA=4; MediumShift=0; MediumMode=2; SlowerMA=28; SlowerShift=0; SlowerMode=2; SoundAlert=0; ChannelPeriod=15; Shift=0; | ||||
| Bars tested | 3218 | Ticks modeled | 217038 | Quality of modeling | 90.00% |
| Graphical errors | 4 | ||||
| Initial deposit | $10,000.00 | ||||
| Net total profit | $21,492.20 | Gross profit | $42,306.00 | Gross loss | -$20,813.80 |
| Profit factor | 2.03 | Expected pay-off | $383.79 | ||
| Absolute drawdown | $1,640.00 | Maximal drawdown (%) | $12,858.00 (30.13%) | Relative drawdown | 30.13% ($12,858.00) |
| Total trades | 56 | Winning SHORT positions (%) | 27 (48.15%) | Winning LONG positions (%) | 29 (62.07%) |
| Trade profits (% of total) | 31 (55.36%) | Trade losses (% of total) | 25 (44.64%) | ||
| Largest | gain per trade | $10,332.40 | loss per trade | -$1,200.00 | |
| Average | gain per trade | $1,364.71 | loss per trade | -$832.55 | |
| Maximum | consecutive wins (profit in $) | 6 ($8,762.00) | consecutive losses (loss in $) | 5 (-$3,373.80) | |
| Maximum | Consecutive wins (winning streak) | $20,349.60 (3) | Consecutive losses (losing streak) | -$4,240.00 (4) | |
| Average | consecutive wins | 2 | consecutive losses | 2 | |
| # | Execution Date | Transaction | Order | Volume | Price | S/L (Stop Loss) | T/P (Take Profit) | Profit | Balance |
| 1 | 2008.06.05 07:00 | buy | 1 | 4.00 | 1.5446 | 1.5416 | 0.0000 | ||
| 2 | 2008.06.05 08:15 | s/l | 1 | 4.00 | 1.5416 | 1.5416 | 0.0000 | -1200.00 | 8800.00 |
| 3 | 2008.06.05 10:00 | sell | 2 | 4.00 | 1.5401 | 1.5431 | 0.0000 | ||
| 4 | 2008.06.05 10:07 | modify | 2 | 4.00 | 1.5401 | 1.5401 | 0.0000 | ||
| 5 | 2008.06.05 11:21 | s/l | 2 | 4.00 | 1.5401 | 1.5401 | 0.0000 | 0.00 | 8800.00 |
| 6 | 2008.06.05 13:30 | buy | 3 | 4.00 | 1.5508 | 1.5478 | 0.0000 | ||
| 7 | 2008.06.05 13:36 | modify | 3 | 4.00 | 1.5508 | 1.5508 | 0.0000 | ||
| 8 | 2008.06.09 13:15 | close | 3 | 4.00 | 1.5765 | 1.5508 | 0.0000 | 10332.40 | 19132.40 |
| 9 | 2008.06.09 13:15 | sell | 4 | 4.00 | 1.5764 | 1.5794 | 0.0000 | ||
| 10 | 2008.06.09 13:22 | modify | 4 | 4.00 | 1.5764 | 1.5764 | 0.0000 | ||
| 11 | 2008.06.11 07:00 | close | 4 | 4.00 | 1.5512 | 1.5764 | 0.0000 | 10017.20 | 29149.60 |
| 12 | 2008.06.11 07:00 | buy | 5 | 4.00 | 1.5513 | 1.5483 | 0.0000 | ||
| 13 | 2008.06.11 07:53 | s/l | 5 | 4.00 | 1.5483 | 1.5483 | 0.0000 | -1200.00 | 27949.60 |
| 14 | 2008.06.11 09:30 | buy | 6 | 4.00 | 1.5498 | 1.5468 | 0.0000 | ||
| 15 | 2008.06.11 11:55 | modify | 6 | 4.00 | 1.5498 | 1.5498 | 0.0000 | ||
| 16 | 2008.06.11 12:50 | s/l | 6 | 4.00 | 1.5498 | 1.5498 | 0.0000 | 0.00 | 27949.60 |
| 17 | 2008.06.12 01:45 | sell | 7 | 4.00 | 1.5499 | 1.5529 | 0.0000 | ||
| 18 | 2008.06.12 02:41 | modify | 7 | 4.00 | 1.5499 | 1.5499 | 0.0000 | ||
| 19 | 2008.06.12 21:30 | close | 7 | 4.00 | 1.5448 | 1.5499 | 0.0000 | 2040.00 | 29989.60 |
| 20 | 2008.06.12 21:30 | buy | 8 | 4.00 | 1.5449 | 1.5419 | 0.0000 | ||
| 21 | 2008.06.12 22:37 | modify | 8 | 4.00 | 1.5449 | 1.5449 | 0.0000 | ||
| 22 | 2008.06.12 23:34 | s/l | 8 | 4.00 | 1.5449 | 1.5449 | 0.0000 | 0.00 | 29989.60 |
| 23 | 2008.06.13 01:15 | buy | 9 | 4.00 | 1.5444 | 1.5414 | 0.0000 | ||
| 24 | 2008.06.13 04:45 | close | 9 | 4.00 | 1.5437 | 1.5414 | 0.0000 | -280.00 | 29709.60 |
| 25 | 2008.06.13 04:45 | sell | 10 | 4.00 | 1.5438 | 1.5468 | 0.0000 | ||
| 26 | 2008.06.13 06:30 | modify | 10 | 4.00 | 1.5438 | 1.5438 | 0.0000 | ||
| 27 | 2008.06.15 22:45 | close | 10 | 4.00 | 1.5386 | 1.5438 | 0.0000 | 2080.00 | 31789.60 |
| 28 | 2008.06.15 22:45 | buy | 11 | 4.00 | 1.5385 | 1.5355 | 0.0000 | ||
| 29 | 2008.06.16 02:29 | modify | 11 | 4.00 | 1.5385 | 1.5385 | 0.0000 | ||
| 30 | 2008.06.16 06:24 | s/l | 11 | 4.00 | 1.5385 | 1.5385 | 0.0000 | 26.20 | 31815.80 |
| 31 | 2008.06.16 07:15 | sell | 12 | 4.00 | 1.5367 | 1.5397 | 0.0000 | ||
| 32 | 2008.06.16 08:22 | s/l | 12 | 4.00 | 1.5397 | 1.5397 | 0.0000 | -1200.00 | 30615.80 |
| 33 | 2008.06.16 08:45 | buy | 13 | 4.00 | 1.5420 | 1.5390 | 0.0000 | ||
| 34 | 2008.06.16 10:35 | modify | 13 | 4.00 | 1.5420 | 1.5420 | 0.0000 | ||
| 35 | 2008.06.17 09:30 | close | 13 | 4.00 | 1.5492 | 1.5420 | 0.0000 | 2906.20 | 33522.00 |
| 36 | 2008.06.17 09:30 | sell | 14 | 4.00 | 1.5493 | 1.5523 | 0.0000 | ||
| 37 | 2008.06.17 15:45 | close | 14 | 4.00 | 1.5508 | 1.5523 | 0.0000 | -600.00 | 32922.00 |
| 38 | 2008.06.17 15:45 | buy | 15 | 4.00 | 1.5509 | 1.5479 | 0.0000 | ||
| 39 | 2008.06.17 22:50 | modify | 15 | 4.00 | 1.5509 | 1.5509 | 0.0000 | ||
| 40 | 2008.06.18 01:39 | s/l | 15 | 4.00 | 1.5509 | 1.5509 | 0.0000 | 26.20 | 32948.20 |
| 41 | 2008.06.18 02:45 | sell | 16 | 4.00 | 1.5497 | 1.5527 | 0.0000 | ||
| 42 | 2008.06.18 05:58 | modify | 16 | 4.00 | 1.5497 | 1.5497 | 0.0000 | ||
| 43 | 2008.06.18 06:31 | s/l | 16 | 4.00 | 1.5497 | 1.5497 | 0.0000 | 0.00 | 32948.20 |
| 44 | 2008.06.18 07:45 | buy | 17 | 4.00 | 1.5523 | 1.5493 | 0.0000 | ||
| 45 | 2008.06.18 08:17 | s/l | 17 | 4.00 | 1.5493 | 1.5493 | 0.0000 | -1200.00 | 31748.20 |
| 46 | 2008.06.18 09:15 | sell | 18 | 4.00 | 1.5489 | 1.5519 | 0.0000 | ||
| 47 | 2008.06.18 10:08 | modify | 18 | 4.00 | 1.5489 | 1.5489 | 0.0000 | ||
| 48 | 2008.06.18 10:47 | s/l | 18 | 4.00 | 1.5489 | 1.5489 | 0.0000 | 0.00 | 31748.20 |
| 49 | 2008.06.18 15:15 | buy | 19 | 4.00 | 1.5506 | 1.5476 | 0.0000 | ||
| 50 | 2008.06.18 17:38 | modify | 19 | 4.00 | 1.5506 | 1.5506 | 0.0000 | ||
| 51 | 2008.06.19 08:30 | close | 19 | 4.00 | 1.5530 | 1.5506 | 0.0000 | 1038.60 | 32786.80 |
| 52 | 2008.06.19 08:30 | sell | 20 | 4.00 | 1.5529 | 1.5559 | 0.0000 | ||
| 53 | 2008.06.19 08:31 | modify | 20 | 4.00 | 1.5529 | 1.5529 | 0.0000 | ||
| 54 | 2008.06.20 02:00 | close | 20 | 4.00 | 1.5517 | 1.5529 | 0.0000 | 448.60 | 33235.40 |
| 55 | 2008.06.20 02:01 | buy | 21 | 4.00 | 1.5518 | 1.5488 | 0.0000 | ||
| 56 | 2008.06.20 06:05 | modify | 21 | 4.00 | 1.5518 | 1.5518 | 0.0000 | ||
| 57 | 2008.06.23 06:00 | close | 21 | 4.00 | 1.5593 | 1.5518 | 0.0000 | 3026.20 | 36261.60 |
| 58 | 2008.06.23 06:00 | sell | 22 | 4.00 | 1.5592 | 1.5622 | 0.0000 | ||
| 59 | 2008.06.23 07:00 | modify | 22 | 4.00 | 1.5592 | 1.5592 | 0.0000 | ||
| 60 | 2008.06.24 05:45 | close | 22 | 4.00 | 1.5525 | 1.5592 | 0.0000 | 2648.60 | 38910.20 |
| 61 | 2008.06.24 05:45 | buy | 23 | 4.00 | 1.5527 | 1.5497 | 0.0000 | ||
| 62 | 2008.06.24 06:32 | modify | 23 | 4.00 | 1.5527 | 1.5527 | 0.0000 | ||
| 63 | 2008.06.24 23:00 | close | 23 | 4.00 | 1.5567 | 1.5527 | 0.0000 | 1600.00 | 40510.20 |
| 64 | 2008.06.24 23:01 | sell | 24 | 4.00 | 1.5566 | 1.5596 | 0.0000 | ||
| 65 | 2008.06.24 23:45 | close | 24 | 4.00 | 1.5575 | 1.5596 | 0.0000 | -360.00 | 40150.20 |
| 66 | 2008.06.24 23:45 | buy | 25 | 4.00 | 1.5574 | 1.5544 | 0.0000 | ||
| 67 | 2008.06.25 03:45 | close | 25 | 4.00 | 1.5568 | 1.5544 | 0.0000 | -213.80 | 39936.40 |
| 68 | 2008.06.25 03:45 | sell | 26 | 4.00 | 1.5566 | 1.5596 | 0.0000 | ||
| 69 | 2008.06.25 04:15 | close | 26 | 4.00 | 1.5576 | 1.5596 | 0.0000 | -400.00 | 39536.40 |
| 70 | 2008.06.25 04:15 | buy | 27 | 4.00 | 1.5575 | 1.5545 | 0.0000 | ||
| 71 | 2008.06.25 06:09 | s/l | 27 | 4.00 | 1.5545 | 1.5545 | 0.0000 | -1200.00 | 38336.40 |
| 72 | 2008.06.25 06:30 | sell | 28 | 4.00 | 1.5557 | 1.5587 | 0.0000 | ||
| 73 | 2008.06.25 08:37 | s/l | 28 | 4.00 | 1.5587 | 1.5587 | 0.0000 | -1200.00 | 37136.40 |
| 74 | 2008.06.25 09:00 | buy | 29 | 4.00 | 1.5589 | 1.5559 | 0.0000 | ||
| 75 | 2008.06.25 13:21 | modify | 29 | 4.00 | 1.5589 | 1.5589 | 0.0000 | ||
| 76 | 2008.06.25 14:35 | s/l | 29 | 4.00 | 1.5589 | 1.5589 | 0.0000 | 0.00 | 37136.40 |
| 77 | 2008.06.25 15:45 | sell | 30 | 4.00 | 1.5564 | 1.5594 | 0.0000 | ||
| 78 | 2008.06.25 18:10 | modify | 30 | 4.00 | 1.5564 | 1.5564 | 0.0000 | ||
| 79 | 2008.06.25 18:12 | s/l | 30 | 4.00 | 1.5564 | 1.5564 | 0.0000 | 0.00 | 37136.40 |
| 80 | 2008.06.25 18:30 | buy | 31 | 4.00 | 1.5649 | 1.5619 | 0.0000 | ||
| 81 | 2008.06.25 18:40 | modify | 31 | 4.00 | 1.5649 | 1.5649 | 0.0000 | ||
| 82 | 2008.06.26 06:54 | s/l | 31 | 4.00 | 1.5649 | 1.5649 | 0.0000 | 78.60 | 37215.00 |
| 83 | 2008.06.26 08:30 | buy | 32 | 4.00 | 1.5679 | 1.5649 | 0.0000 | ||
| 84 | 2008.06.26 09:50 | modify | 32 | 4.00 | 1.5679 | 1.5679 | 0.0000 | ||
| 85 | 2008.06.27 03:15 | close | 32 | 4.00 | 1.5727 | 1.5679 | 0.0000 | 1946.20 | 39161.20 |
| 86 | 2008.06.27 03:15 | sell | 33 | 4.00 | 1.5726 | 1.5756 | 0.0000 | ||
| 87 | 2008.06.27 06:45 | close | 33 | 4.00 | 1.5739 | 1.5756 | 0.0000 | -520.00 | 38641.20 |
| 88 | 2008.06.27 06:45 | buy | 34 | 4.00 | 1.5738 | 1.5708 | 0.0000 | ||
| 89 | 2008.06.27 07:30 | close | 34 | 4.00 | 1.5733 | 1.5708 | 0.0000 | -200.00 | 38441.20 |
| 90 | 2008.06.27 07:30 | sell | 35 | 4.00 | 1.5734 | 1.5764 | 0.0000 | ||
| 91 | 2008.06.27 08:00 | close | 35 | 4.00 | 1.5743 | 1.5764 | 0.0000 | -360.00 | 38081.20 |
| 92 | 2008.06.27 08:00 | buy | 36 | 4.00 | 1.5744 | 1.5714 | 0.0000 | ||
| 93 | 2008.06.27 08:39 | modify | 36 | 4.00 | 1.5744 | 1.5744 | 0.0000 | ||
| 94 | 2008.06.27 10:50 | s/l | 36 | 4.00 | 1.5744 | 1.5744 | 0.0000 | 0.00 | 38081.20 |
| 95 | 2008.06.27 13:45 | buy | 37 | 4.00 | 1.5756 | 1.5726 | 0.0000 | ||
| 96 | 2008.06.27 17:13 | modify | 37 | 4.00 | 1.5756 | 1.5756 | 0.0000 | ||
| 97 | 2008.06.30 11:15 | s/l | 37 | 4.00 | 1.5756 | 1.5756 | 0.0000 | 26.20 | 38107.40 |
| 98 | 2008.06.30 11:45 | sell | 38 | 4.00 | 1.5769 | 1.5799 | 0.0000 | ||
| 99 | 2008.06.30 12:26 | modify | 38 | 4.00 | 1.5769 | 1.5769 | 0.0000 | ||
| 100 | 2008.07.01 01:15 | sell | 39 | 4.00 | 1.5741 | 1.5771 | 0.0000 | ||
| 101 | 2008.07.01 06:00 | s/l | 39 | 4.00 | 1.5771 | 1.5771 | 0.0000 | -1200.00 | 36907.40 |
| 102 | 2008.07.01 06:30 | buy | 40 | 4.00 | 1.5773 | 1.5743 | 0.0000 | ||
| 103 | 2008.07.01 06:51 | s/l | 40 | 4.00 | 1.5743 | 1.5743 | 0.0000 | -1200.00 | 35707.40 |
| 104 | 2008.07.01 07:30 | sell | 41 | 4.00 | 1.5743 | 1.5773 | 0.0000 | ||
| 105 | 2008.07.01 08:45 | close | 41 | 4.00 | 1.5760 | 1.5773 | 0.0000 | -680.00 | 35027.40 |
| 106 | 2008.07.01 08:45 | buy | 42 | 4.00 | 1.5761 | 1.5731 | 0.0000 | ||
| 107 | 2008.07.01 09:51 | modify | 42 | 4.00 | 1.5761 | 1.5761 | 0.0000 | ||
| 108 | 2008.07.01 14:00 | s/l | 42 | 4.00 | 1.5761 | 1.5761 | 0.0000 | 0.00 | 35027.40 |
| 109 | 2008.07.01 15:30 | sell | 43 | 4.00 | 1.5769 | 1.5799 | 0.0000 | ||
| 110 | 2008.07.01 16:00 | close | 43 | 4.00 | 1.5780 | 1.5799 | 0.0000 | -440.00 | 34587.40 |
| 111 | 2008.07.01 16:00 | buy | 44 | 4.00 | 1.5779 | 1.5749 | 0.0000 | ||
| 112 | 2008.07.01 16:17 | modify | 44 | 4.00 | 1.5779 | 1.5779 | 0.0000 | ||
| 113 | 2008.07.02 10:15 | sell | 45 | 4.00 | 1.5782 | 1.5812 | 0.0000 | ||
| 114 | 2008.07.02 11:52 | s/l | 45 | 4.00 | 1.5812 | 1.5812 | 0.0000 | -1200.00 | 33387.40 |
| 115 | 2008.07.02 12:45 | buy | 46 | 4.00 | 1.5839 | 1.5809 | 0.0000 | ||
| 116 | 2008.07.02 12:59 | modify | 46 | 4.00 | 1.5839 | 1.5839 | 0.0000 | ||
| 117 | 2008.07.03 12:35 | s/l | 46 | 4.00 | 1.5839 | 1.5839 | 0.0000 | 78.60 | 33466.00 |
| 118 | 2008.07.03 13:00 | sell | 47 | 4.00 | 1.5766 | 1.5796 | 0.0000 | ||
| 119 | 2008.07.03 13:07 | modify | 47 | 4.00 | 1.5766 | 1.5766 | 0.0000 | ||
| 120 | 2008.07.07 00:00 | sell | 48 | 4.00 | 1.5693 | 1.5723 | 0.0000 | ||
| 121 | 2008.07.07 00:28 | modify | 48 | 4.00 | 1.5693 | 1.5693 | 0.0000 | ||
| 122 | 2008.07.07 12:00 | close | 48 | 4.00 | 1.5655 | 1.5693 | 0.0000 | 1520.00 | 34986.00 |
| 123 | 2008.07.07 12:00 | buy | 49 | 4.00 | 1.5656 | 1.5626 | 0.0000 | ||
| 124 | 2008.07.07 12:30 | close | 49 | 4.00 | 1.5643 | 1.5626 | 0.0000 | -520.00 | 34466.00 |
| 125 | 2008.07.07 12:30 | sell | 50 | 4.00 | 1.5642 | 1.5672 | 0.0000 | ||
| 126 | 2008.07.07 15:05 | s/l | 50 | 4.00 | 1.5672 | 1.5672 | 0.0000 | -1200.00 | 33266.00 |
| 127 | 2008.07.07 15:15 | buy | 51 | 4.00 | 1.5666 | 1.5636 | 0.0000 | ||
| 128 | 2008.07.07 16:25 | modify | 51 | 4.00 | 1.5666 | 1.5666 | 0.0000 | ||
| 129 | 2008.07.08 02:45 | close | 51 | 4.00 | 1.5695 | 1.5666 | 0.0000 | 1186.20 | 34452.20 |
| 130 | 2008.07.08 02:47 | sell | 52 | 4.00 | 1.5696 | 1.5726 | 0.0000 | ||
| 131 | 2008.07.08 04:15 | close | 52 | 4.00 | 1.5712 | 1.5726 | 0.0000 | -640.00 | 33812.20 |
| 132 | 2008.07.08 04:15 | buy | 53 | 4.00 | 1.5713 | 1.5683 | 0.0000 | ||
| 133 | 2008.07.08 06:58 | s/l | 53 | 4.00 | 1.5683 | 1.5683 | 0.0000 | -1200.00 | 32612.20 |
| 134 | 2008.07.08 07:00 | sell | 54 | 4.00 | 1.5684 | 1.5714 | 0.0000 | ||
| 135 | 2008.07.08 07:47 | s/l | 54 | 4.00 | 1.5714 | 1.5714 | 0.0000 | -1200.00 | 31412.20 |
| 136 | 2008.07.08 08:15 | buy | 55 | 4.00 | 1.5740 | 1.5710 | 0.0000 | ||
| 137 | 2008.07.08 10:41 | s/l | 55 | 4.00 | 1.5710 | 1.5710 | 0.0000 | -1200.00 | 30212.20 |
| 138 | 2008.07.08 11:45 | sell | 56 | 4.00 | 1.5697 | 1.5727 | 0.0000 | ||
| 139 | 2008.07.08 12:37 | modify | 56 | 4.00 | 1.5697 | 1.5697 | 0.0000 | ||
| 140 | 2008.07.08 17:24 | close at stop | 56 | 4.00 | 1.5665 | 1.5697 | 0.0000 | 1280.00 | 31492.20 |


Comments 0