Try it out first! Imagine turning $5,000 into a whopping $243,000 in just three months. Sounds unreal? Well, we're looking for coders to help us finish this exciting project!
Strategy Tester Report
The MasterMind
AlpariUS-Demo (Build 216)
| Symbol | EURUSD (Euro vs US Dollar) | ||||
| Period | 5 Minutes (M5) 31st March 2008 00:00 - 19th June 2008 07:30 | ||||
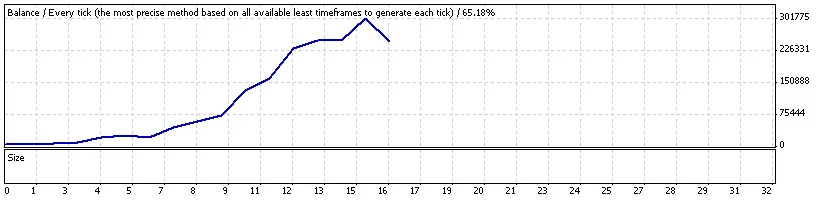
| Model | Every tick (the most precise method based on all available least timeframes) | ||||
| Parameters | Lots=200; StopLoss=2000; TakeProfit=0; TradeAtCloseBar=true; TrailingStop=0; TrailingStep=1; BreakEven=0; MagicNumber=0; Repeat=3; Periods=5; UseAlert=false; SendEmail=true; TradeLog="MasterMind"; Slippage=3; Indicator_Setting="---------- Indicator Setting"; Crash=false; TimeFrame=0; Length=5; Method=3; Smoothing=1; Filter=5; RealTime=true; Steady=false; Color=true; Alerts=true; EmailON=false; SignalPrice=true; SignalPriceBUY=Yellow; SignalPriceSELL=Aqua; CountBars=1485; | ||||
| Bars in test | 17,601 | Ticks modeled | 587,455 | Model quality | 65.18% |
| Mismatched charts errors | 62 | ||||
| Initial deposit | $5,000.00 | ||||
| Total net profit | $243,061.68 | Gross profit | $300,660.90 | Gross loss | -$57,599.22 |
| Profit factor | 5.22 | Expected payoff | $15,191.35 | ||
| Absolute drawdown | $4,202.40 | Maximal drawdown | $182,004.27 (47.03%) | Relative drawdown | 90.11% ($163,677.74) |
| Total trades | 16 | Short positions (won %) | 8 (75.00%) | Long positions (won %) | 8 (100.00%) |
| Profit trades (% of total) | 14 (87.50%) | Loss trades (% of total) | 2 (12.50%) | ||
| Largest | profit trade | $71,525.61 | loss trade | -$54,596.85 | |
| Average | profit trade | $21,475.78 | loss trade | -$28,799.61 | |
| Maximum | consecutive wins (profit in money) | 9 ($279,697.49) | consecutive losses (loss in money) | 1 (-$54,596.85) | |
| Maximal | consecutive profit (count of wins) | $279,697.49 (9) | consecutive loss (count of losses) | -$54,596.85 (1) | |
| Average | consecutive wins | 7 | consecutive losses | 1 | |
| # | Time | Type | Order | Size | Price | S / L | T / P | Profit | Balance |
| 1 | 31st March 2008 20:50 | buy | 1 | 1.60 | 1.5774 | 1.3774 | 0.0000 | ||
| 2 | 9th April 2008 19:00 | close | 1 | 1.60 | 1.5855 | 1.3774 | 0.0000 | $1,334.88 | $6,334.88 |
| 3 | 9th April 2008 19:00 | sell | 2 | 2.10 | 1.5856 | 1.7856 | 0.0000 | ||
| 4 | 10th April 2008 18:45 | close | 2 | 2.10 | 1.5729 | 1.7856 | 0.0000 | $2,608.41 | $8,943.29 |
| 5 | 10th April 2008 18:45 | buy | 3 | 3.00 | 1.5730 | 1.3730 | 0.0000 | ||
| 6 | 11th April 2008 04:45 | close | 3 | 3.00 | 1.5773 | 1.3730 | 0.0000 | $1,298.10 | $10,241.39 |
| 7 | 11th April 2008 04:46 | sell | 4 | 3.40 | 1.5772 | 1.7772 | 0.0000 | ||
| 8 | 12th May 2008 05:55 | close | 4 | 3.40 | 1.5405 | 1.7772 | 0.0000 | $11,561.02 | $21,802.41 |
| 9 | 12th May 2008 05:55 | buy | 5 | 7.30 | 1.5404 | 1.3404 | 0.0000 | ||
| 10 | 12th May 2008 12:50 | close | 5 | 7.30 | 1.5461 | 1.3404 | 0.0000 | $4,161.00 | $25,963.41 |
| 11 | 12th May 2008 12:50 | sell | 6 | 8.70 | 1.5462 | 1.7462 | 0.0000 | ||
| 12 | 19th May 2008 17:20 | close | 6 | 8.70 | 1.5490 | 1.7462 | 0.0000 | -$3,002.37 | $22,961.04 |
| 13 | 19th May 2008 17:20 | buy | 7 | 7.70 | 1.5489 | 1.3489 | 0.0000 | ||
| 14 | 21st May 2008 22:10 | close | 7 | 7.70 | 1.5789 | 1.3489 | 0.0000 | $23,141.58 | $46,102.62 |
| 15 | 21st May 2008 22:10 | sell | 8 | 15.40 | 1.5788 | 1.7788 | 0.0000 | ||
| 16 | 27th May 2008 22:05 | close | 8 | 15.40 | 1.5684 | 1.7788 | 0.0000 | $15,156.68 | $61,259.30 |
| 17 | 27th May 2008 22:05 | buy | 9 | 20.50 | 1.5685 | 1.3685 | 0.0000 | ||
| 18 | 28th May 2008 09:20 | close | 9 | 20.50 | 1.5750 | 1.3685 | 0.0000 | $13,380.35 | $74,639.65 |
| 19 | 28th May 2008 09:20 | sell | 10 | 25.00 | 1.5751 | 1.7751 | 0.0000 | ||
| 20 | 29th May 2008 18:10 | close | 10 | 25.00 | 1.5517 | 1.7751 | 0.0000 | $57,802.50 | $132,442.15 |
| 21 | 29th May 2008 18:10 | buy | 11 | 44.40 | 1.5518 | 1.3518 | 0.0000 | ||
| 22 | 5th June 2008 20:15 | close | 11 | 44.40 | 1.5581 | 1.3518 | 0.0000 | $28,811.16 | $161,253.31 |
| 23 | 5th June 2008 20:15 | sell | 12 | 54.10 | 1.5582 | 1.7582 | 0.0000 | ||
| 24 | 10th June 2008 20:45 | close | 12 | 54.10 | 1.5447 | 1.7582 | 0.0000 | $71,525.61 | $232,778.92 |
| 25 | 10th June 2008 20:46 | buy | 13 | 78.10 | 1.5445 | 1.3445 | 0.0000 | ||
| 26 | 13th June 2008 00:30 | close | 13 | 78.10 | 1.5466 | 1.3445 | 0.0000 | $17,455.35 | $250,234.27 |
| 27 | 13th June 2008 00:30 | sell | 14 | 83.90 | 1.5467 | 1.7467 | 0.0000 | ||
| 28 | 17th June 2008 02:15 | close | 14 | 83.90 | 1.5465 | 1.7467 | 0.0000 | $117.46 | $250,351.73 |
| 29 | 17th June 2008 02:15 | buy | 15 | 84.00 | 1.5464 | 1.3464 | 0.0000 | ||
| 30 | 18th June 2008 19:40 | close | 15 | 84.00 | 1.5526 | 1.3464 | 0.0000 | $52,306.80 | $302,658.53 |
| 31 | 18th June 2008 19:40 | sell | 16 | 101.50 | 1.5527 | 1.7527 | 0.0000 | ||
| 32 | 19th June 2008 07:30 | close at stop | 16 | 101.50 | 1.5578 | 1.7527 | 0.0000 | -$54,596.85 | $248,061.68 |


Comments 0