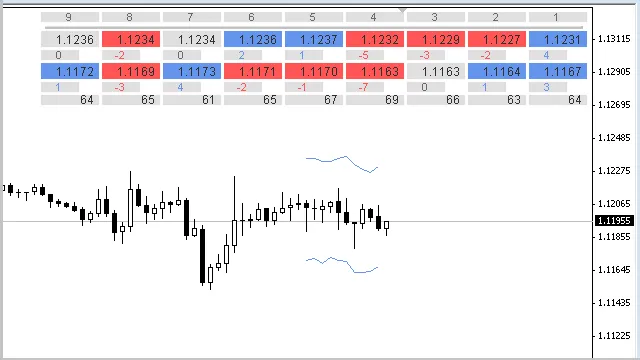
Hey there, fellow traders! Today, we're diving into the ID Lite Info MA indicator—an essential tool for anyone using MetaTrader 4. This nifty indicator helps you visualize two different Moving Averages (MAs) right on your current timeframe. It displays nine values, including the differences between the previous sequential MAs and the deltas in points.
You have the flexibility to tweak how the data is presented, adjusting for positive or negative offsets, and rounding to your preferred decimal places. Just a heads up, it doesn’t display values for the current (zero) bar.
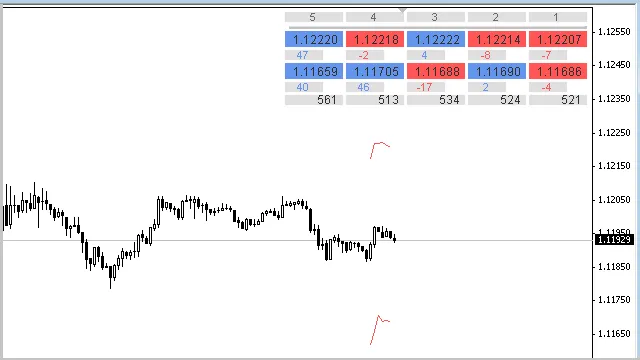
The ID Lite Info MA can also showcase key market data like the Open, High, Low, and Close prices of the bars, along with the deltas between them. This means you can keep an eye on things like candlestick sizes—pretty handy, right?
For those using MetaTrader 5, there’s an equivalent indicator available in the Code Base.
One cool feature of this indicator is its color-coding system. As the values change, the colors in the indicator table will shift accordingly—making it easy to spot which values are increasing, decreasing, or staying the same. Just keep in mind that the delta values between the moving averages won’t change color.
The calculations update with the arrival of a new bar or when you adjust the indicator's parameters, the timeframe, or the trading symbol. If nine values per row feel like overkill, you can easily adjust that by changing the number in this line of code:
#define ARRAY_SIZE_X 9
Fun Fact: If you ever find the indicator table getting in the way, you can hide it with a quick click on the horizontal bar beneath the table heading.
Note: The table shows bar numbers for which the indicator displays MA values. You can customize the starting bar number in the parameters. The current (zero) bar isn't included to avoid cluttering your view with constantly changing data. If you want to display data as it updates with each tick, you’ll need a different code structure.
- You can check the parameters of each Moving Average by hovering your cursor over the table cells.
Note: To see tooltips with parameter values, ensure your chart properties have the "Show object descriptions" option enabled.
- Instead of MA values, you can display data with specific offsets in points from each Moving Average or bar marks.
Note: To show the Open, High, Low, and Close of adjacent bars instead of MAs, set the following parameters:With these settings, the indicator calculates values directly from bar marks without needing to call the iMA function.
- Period Moving Averages... = 1;
- MA method...= MODE_SMA;
- Apply to... = PRICE_OPEN, PRICE_HIGH, PRICE_LOW, or PRICE_CLOSE.
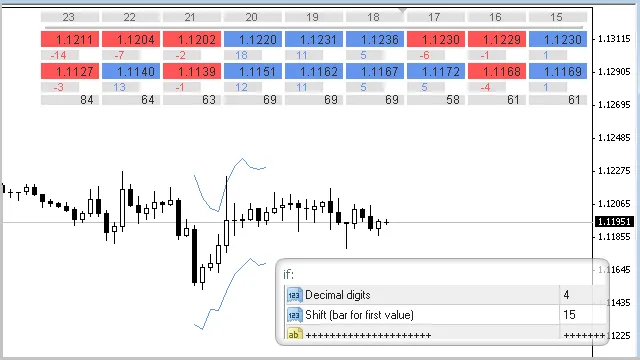
- If you need MA values rounded to a specific decimal, just set that in the Decimal digits input parameter.
- You can also disable the display of indicator lines in the input parameters.
Note: The line colors depend on the direction of the first calculated bar values, which is defined in the line: "Shift (bar for first value):". The indicator lines extend one bar deeper into the chart than the number of MA values in the table, allowing you to see how the last bar in the table compares.
- In the input parameters, you can adjust the table's X and Y offsets, cell sizes, font sizes, colors, and even bring the table to the front if needed.
Version Updates:
Version 1.81 (05.08.2015): Code adjustments were made to enhance efficiency without altering the indicator's capabilities—aligning it more closely with the MetaTrader 5 version.
Version 1.86 (25.09.2015):
- The maximum period limit for Moving Averages was increased from 500 to 3000 bars. This can be customized in the function body:
bool CheckInput(int period,string text)
- Minor cosmetic and optimization tweaks were also made to improve code efficiency.
Related Posts
- Unlocking the Power of Master Tools for MetaTrader 4
- Unlocking MetaCOT 2: Your Ultimate CFTC Indicator Toolkit for MT4
- Hourly Buffers for Data Collection in MetaTrader 5: A Simple Guide
- Unlock Trading Insights with Volume Profile + Range v6.0 for MetaTrader 5
- Mastering the Open Range Breakout Indicator for MetaTrader 5