Introducing the Donchian Ultimate Indicator for MT4 – this isn't just your run-of-the-mill Donchian channel. We've packed it with features to enhance your trading experience:
- Adjustable period and shift for the Donchian channel.
- A middle line option that you can toggle off.
- Multi-timeframe (MTF) support for versatile analysis.
- Five distinct calculation methods for setting channel boundaries.
- Optional support and resistance zones near the main Donchian channel borders.
- A robust alert system to keep you informed.
- Extensive customization to fit your trading style.
This indicator operates within the main window and doesn’t rely on any standard or custom indicators in its code. The Donchian Ultimate is compatible with MT4, MT5, and cTrader platforms.
Input Parameters
- Period (default = 20) — sets the period for the Donchian channel.
- Timeframe (default = Current) — choose the timeframe for channel calculation. If set to a higher timeframe, it’ll display that channel on your current chart. Lower timeframe settings will be ignored.
- Price Type (default = Highest High (Lowest Low)) — select the price type for calculations. Options include:
- Highest High (Lowest Low) — classic setup with the upper band as the Highest High and the lower band as the Lowest Low of the period.
- Average Highest High, Highest Open (Lowest Low, Lowest Open) — upper band as the average of the Highest High and Highest Open, lower band as the average of the Lowest Low and Lowest Open.
- Average Highest High, Highest Close (Lowest Low, Lowest Close) — upper band as the average of the Highest High and Highest Close, lower band as the average of the Lowest Low and Lowest Close.
- Highest Open (Lowest Open) — upper band as the Highest Open, lower band as the Lowest Open.
- Highest Close (Lowest Close) — upper band as the Highest Close, lower band as the Lowest Close.
- Shift (default = 0) — sets the indicator's shift in bars.
- Show Resistance Span (default = true) — if true, the upper resistance span will show on your chart.
- Show Support Span (default = true) — if true, the lower support span will show on your chart.
- Alert Candle (default = Previous) — choose the candle for alerts: Previous for the last closed candle or Current for the ongoing candle.
- Alert About Bullish Crossing of Mid Line (default = true) — if true, alerts will trigger when a candle closes crossing the middle line from below.
- Alert About Bearish Crossing of Mid Line (default = true) — if true, alerts will trigger when a candle closes crossing the middle line from above.
- Alert About Candle Close Inside Resistance (default = true) — if true, alerts will trigger when a candle closes inside the resistance zone.
- Alert About Candle Close Inside Support (default = true) — if true, alerts will trigger when a candle closes inside the support zone.
- Show Alert (default = false) — if true, the indicator will utilize MetaTrader's built-in pop-up alerts.
- Send Email (default = false) — if true, the indicator will send email alerts via MetaTrader. Ensure your email settings are configured under Tools > Options > Email.
- Send Notification (default = false) — if true, the indicator will send push notifications through MetaTrader. Set these up in Tools > Options > Notifications.
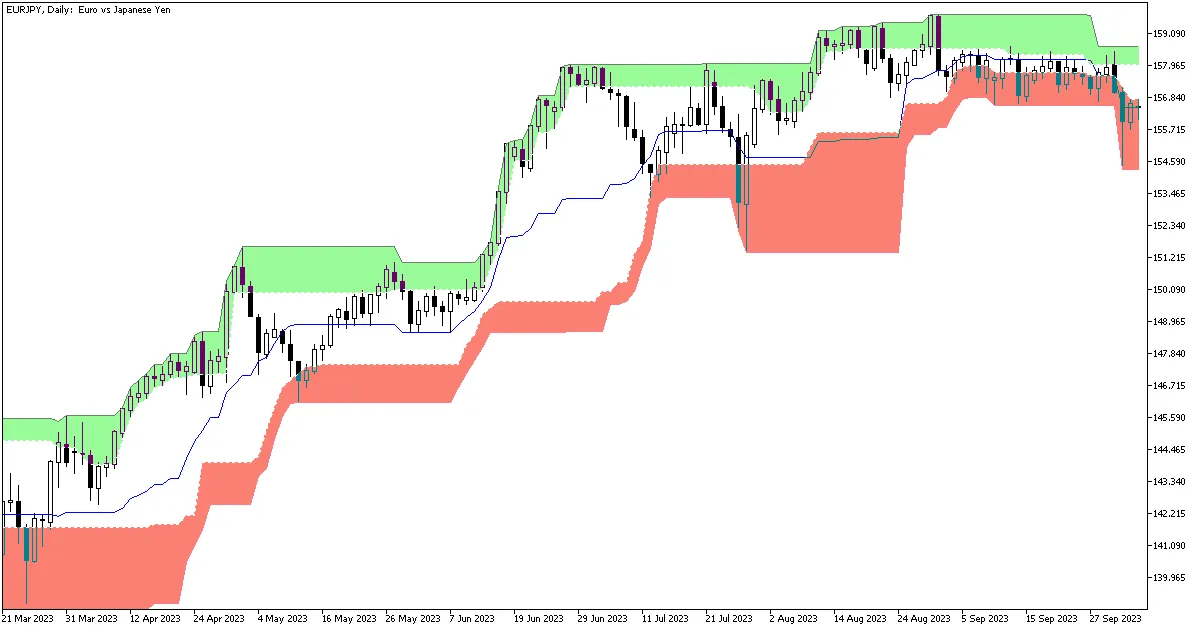
Example and Strategy
Like the classic Donchian channel, the Donchian Ultimate isn’t designed to generate buy or sell signals on its own. However, it effectively illustrates the current trend situation and indicates how close the price is to reversing or continuing the trend. Check out the chart below — you’ll notice the upper band rises steadily when a trend kicks off, while both bands tend to move sideways during consolidation:


Comments 0