If you're familiar with Bollinger Bands, you'll love Sigma Bands! This advanced indicator takes the concept of Bollinger Bands and adds a whole new layer of customization and functionality.
So, what’s the deal with Sigma Bands? Well, I’ve done some serious analysis of price movement over a specific number of bars—specifically, BarsCount = 200. To achieve this, I utilized a moving average (MA) with a period of 1, noted as MAPeriod. However, you can pick any MA and any number of bars for your analysis. The result? Two distinct channels: one that shows where the price typically resides 68% of the time, and another that captures the limits of the price movements 95% of the time.
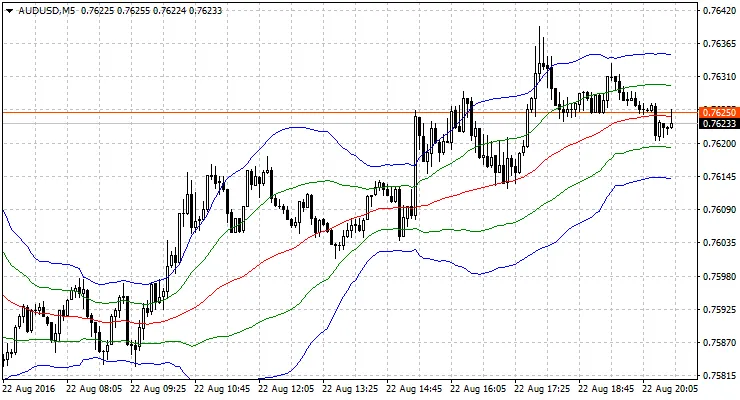
When you use the default settings for Sigma Bands, you'll find it closely resembles the traditional Bollinger Bands with the same period, which is equal to BarsCount. But here's the kicker: Sigma Bands allow you to plot Bollinger Bands using any period by simply adjusting the BarsCount. Plus, you can choose from different types of moving averages!
Supported MA Types:
- Simple MA
- Exponential MA
- Smoothed MA
- Linear-weighted MA
Prices for Channel Plotting:
- Close Price
- Open Price
- High Price
- Low Price
- Median Price: (High + Low) / 2
- Typical Price: (High + Low + Close) / 3
- Weighted Close Price: (High + Low + Close + Close) / 4
These customizable settings aren’t available with standard Bollinger Bands, giving you an edge in your trading strategy.
By understanding how to pinpoint the limits where any indicator or price typically ranges, I was inspired to create this indicator based on standard deviation and Sigma calculations. The formulas can be tailored for any indicator you wish to analyze. Sometimes, you can discover fascinating results with indicators displayed in separate windows, like RSI or TVI.
Recommendations:
To truly see the differences between conventional Bollinger Bands and Sigma Bands, try using non-default settings with MAPeriod > 1.
Settings:
int MAPeriod = 1; // MA Periodint BarsCount = 200; // Bars for calculating the deviation (Sigma)int TypeBandsMA = 0; // Type of MA for Bandsint TypePriceMA = 0; // Applied price of MAcolor MAColor = clrNONE; // MA colorThe analyzed MA is colorless by default. If you want to see it, simply set a color in the MAColor parameter.


Comments 0